Review today’s target portfolio first
Start with the current policy-generated allocation, then inspect the ranked universe and supporting risk signals before investigating a company.
Current Target Portfolio
The latest policy-generated holdings for the open quarter, with target weights normalized to 100%.
Loading current holdings...
| Rank | Symbol | Target Weight | Policy Rank | Price Date | Price |
|---|
Company Rankings by Fundamental Analysis
Filter the ranked universe and open company-level fundamentals when a current target needs deeper validation.
Data updated:
Checking...
Universe:
--
Method: ELO
The Magic Compounding Effect
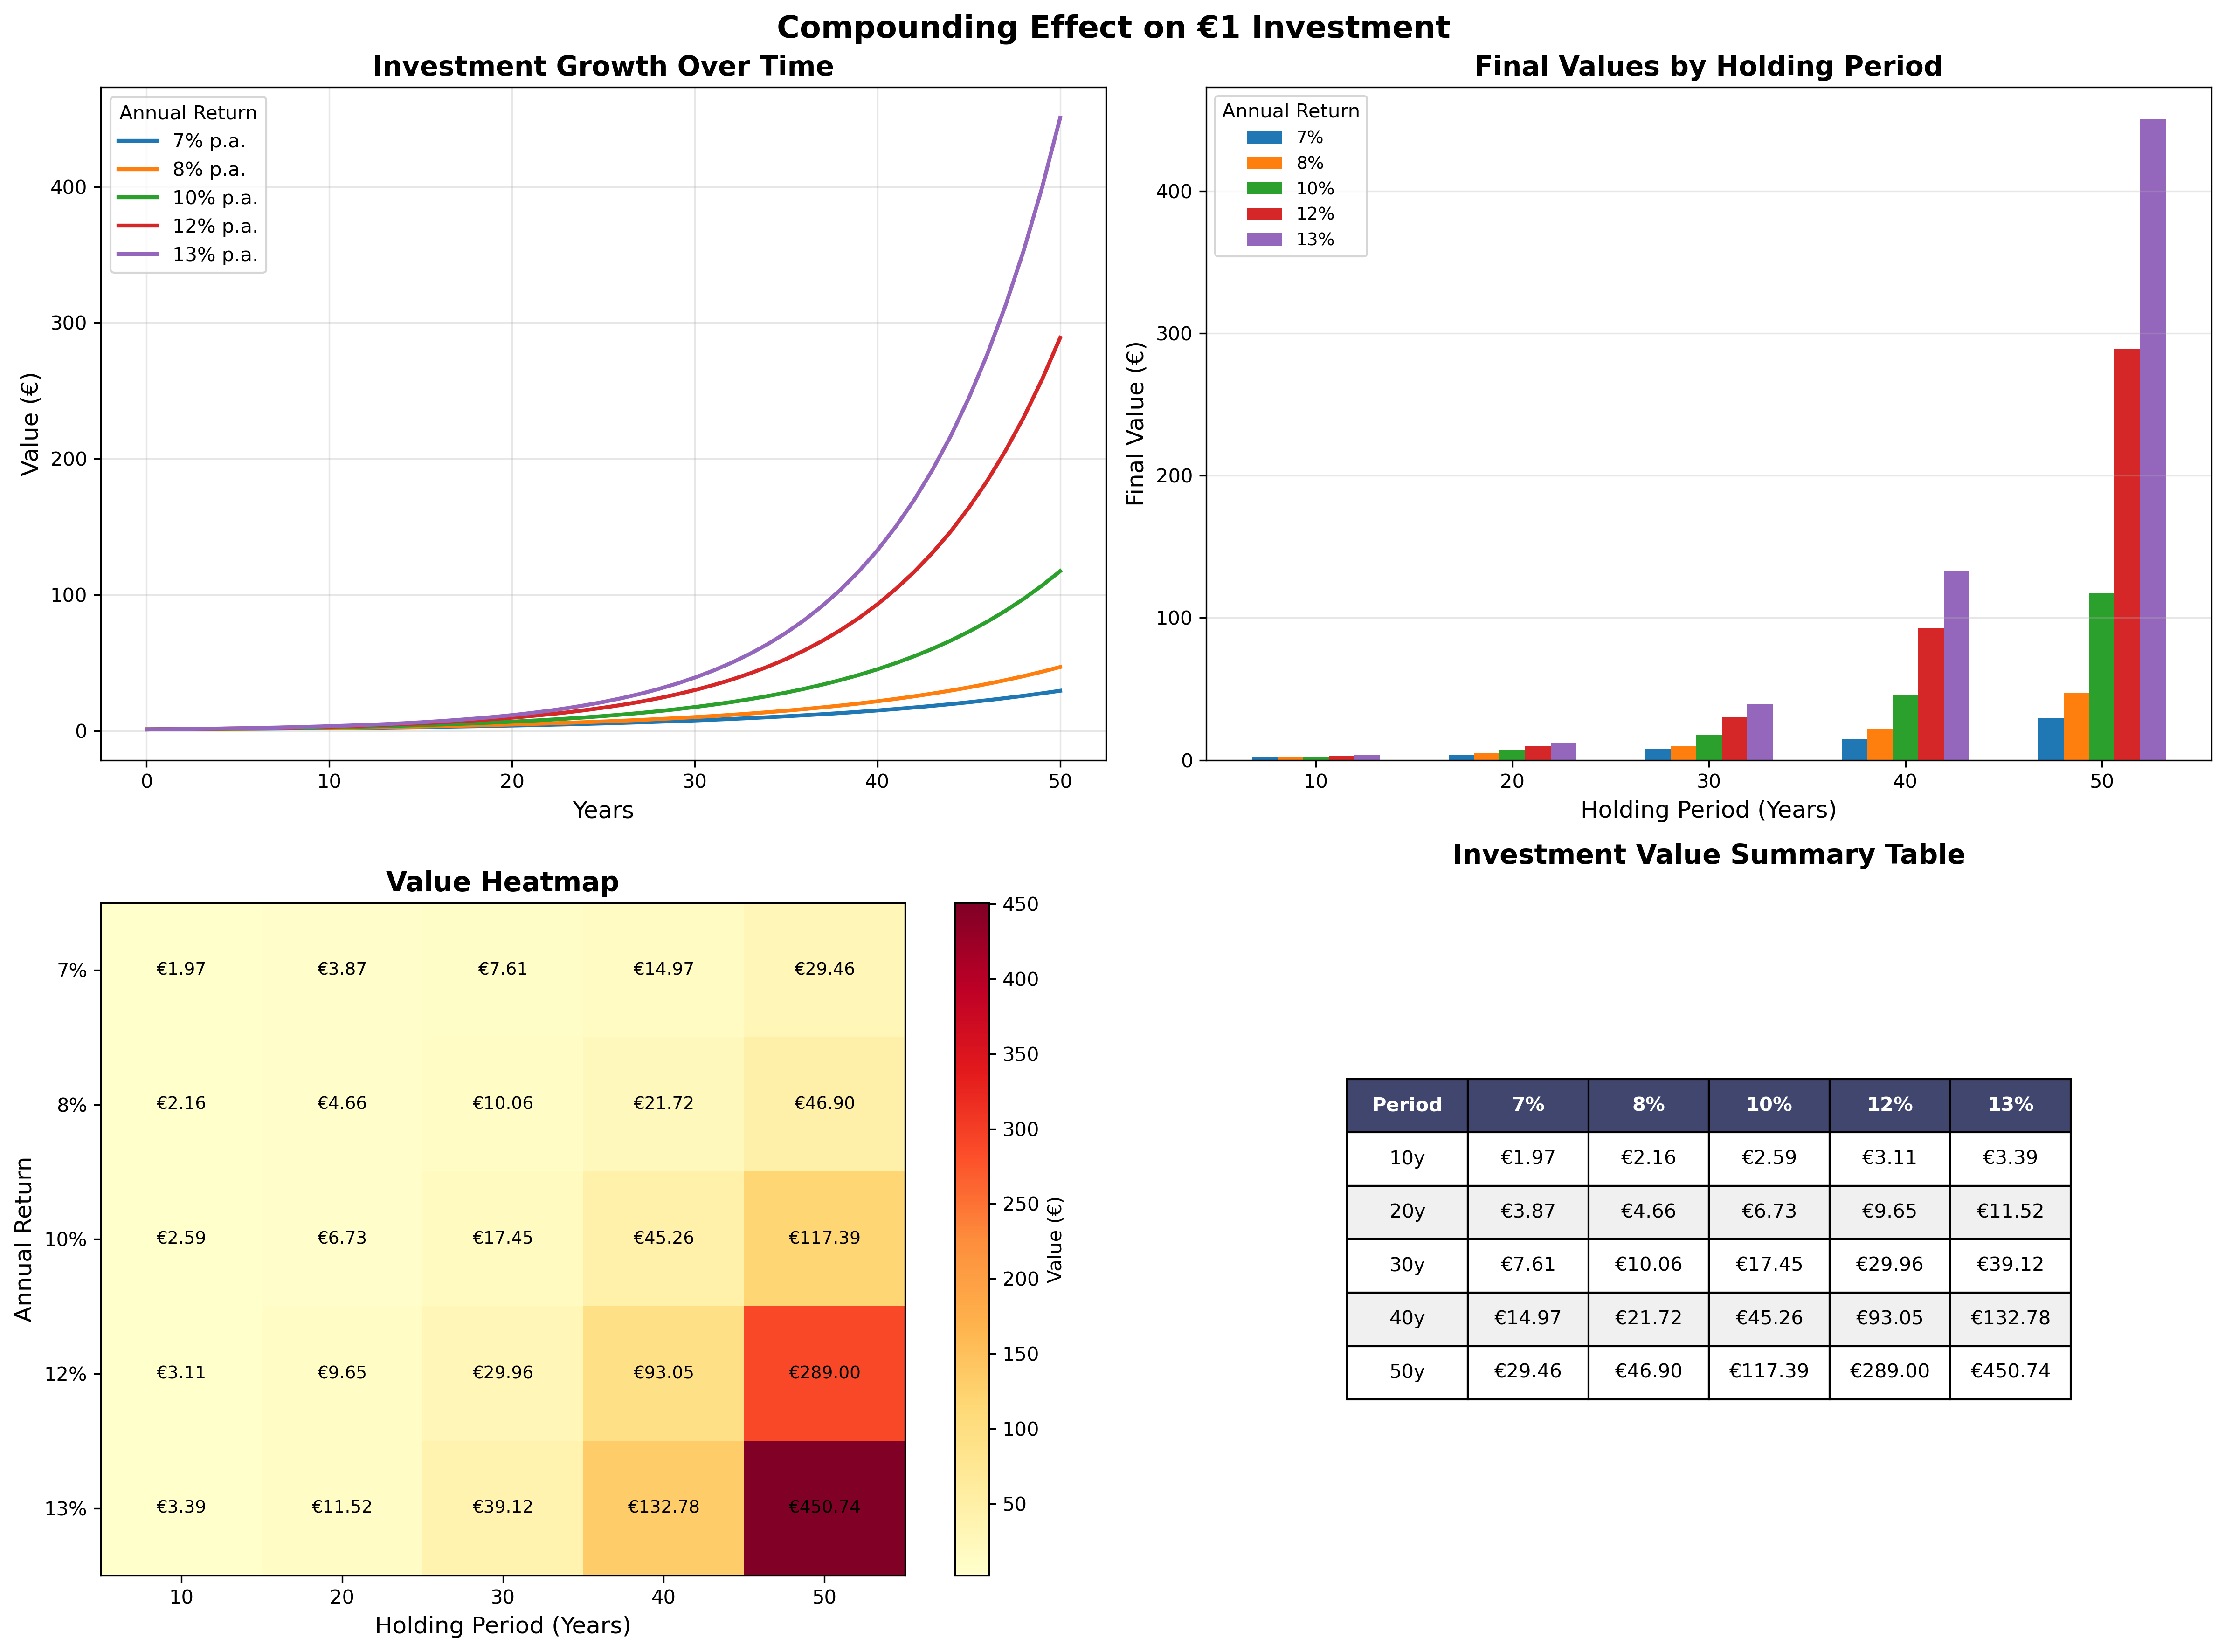
Time in the market trumps timing the market. This analysis reveals that holding period matters far more than chasing the highest returns—a modest but consistent return held over decades will dramatically outperform higher returns over shorter periods. The mathematics of compounding show that patience and discipline are the most powerful wealth-building tools, not exceptional stock-picking ability.
Portfolio Performance
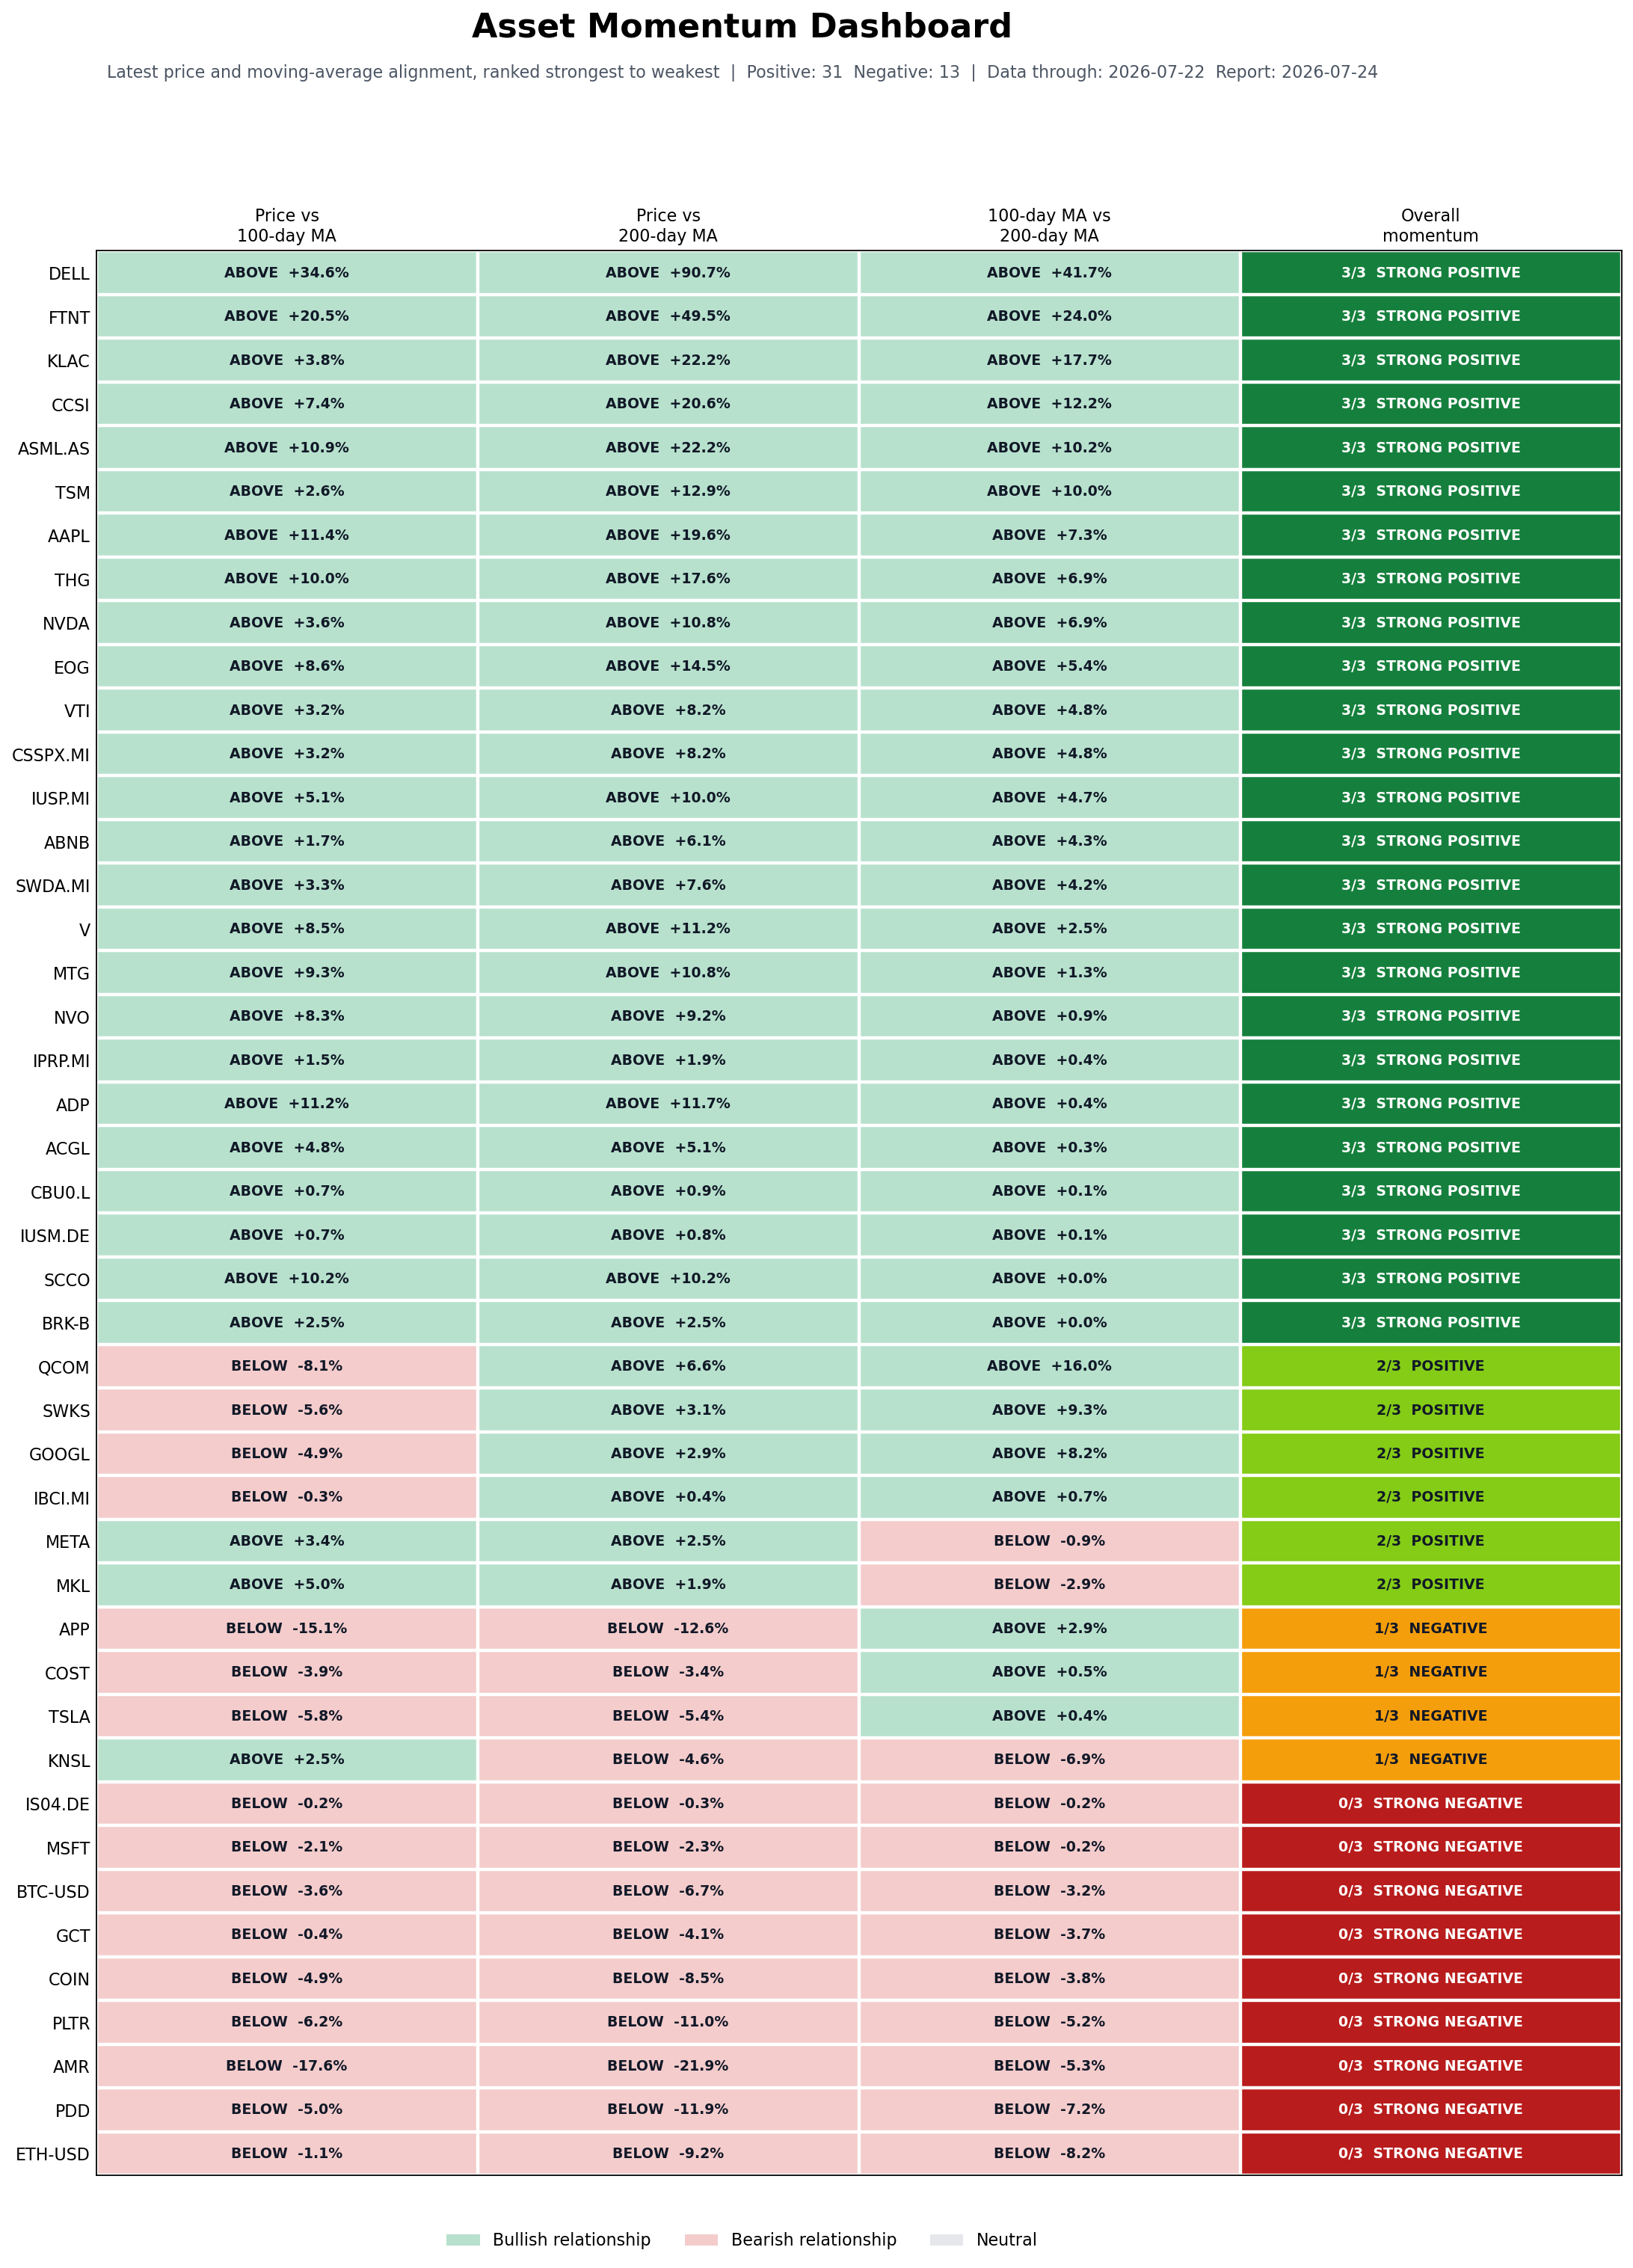
Compare current momentum across the tracked universe, then inspect portfolio drawdowns and recovery signals.
How to read this
What this shows
Each stock is tested on price versus its 100-day average, price versus its 200-day average, and the 100-day average versus the 200-day average.
How to read
Green means the first value is above the second; red means it is below. Stocks are ranked from strongest to weakest.
Momentum score
3/3 is fully positive momentum, 2/3 is positive, 1/3 is negative, and 0/3 is fully negative momentum.
Caveats
Moving averages are lagging indicators. Use this as a quick trend summary, not as a standalone buy or sell signal.
How to read this
What this shows
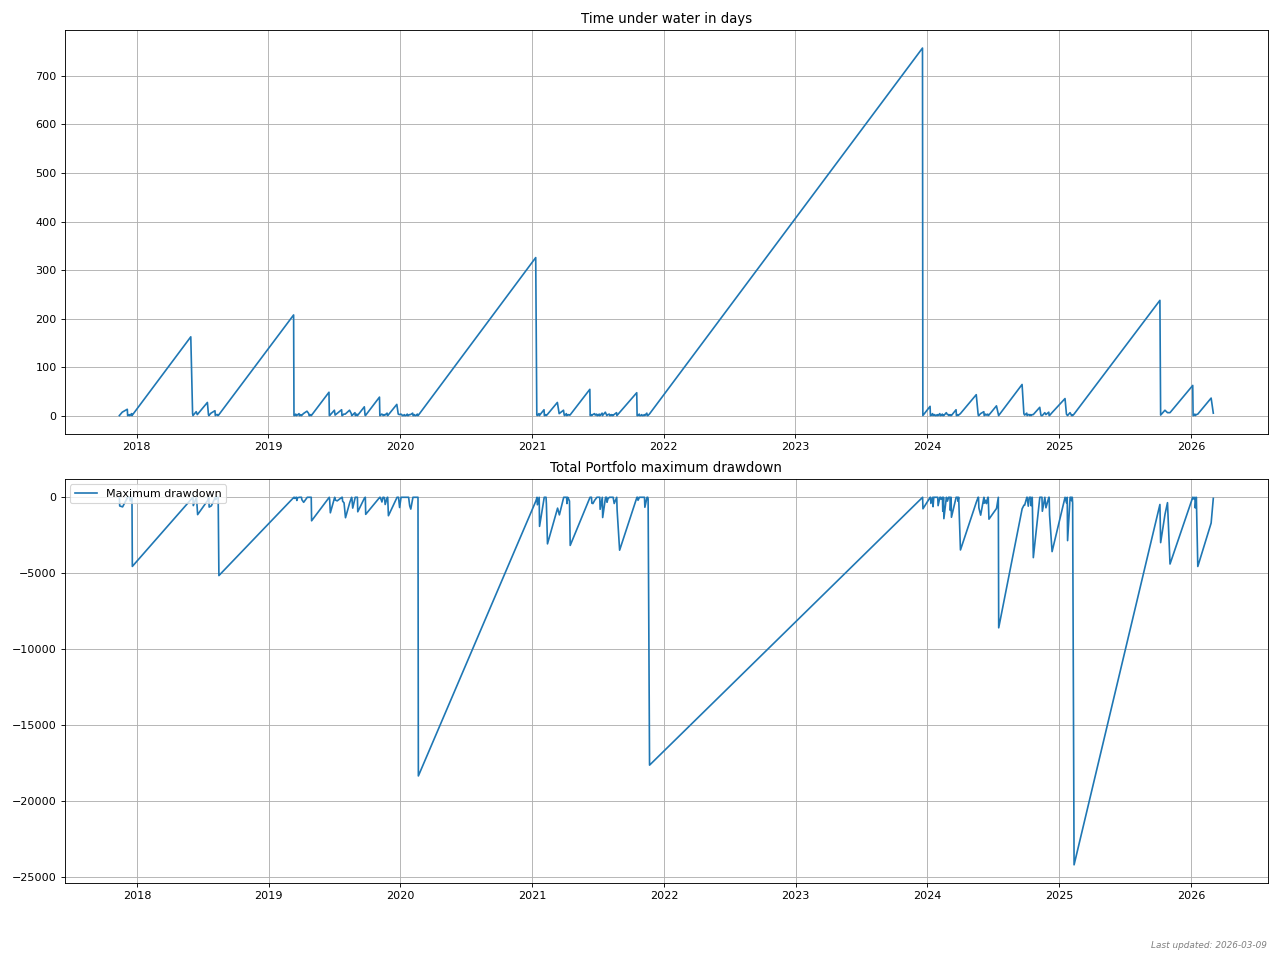
How long (days) and how deep (money) the portfolio stayed below its previous all-time high.
How to read
Touching the x-axis means a new peak; below it means the portfolio is still recovering.
Why it matters
Longer/deeper drawdowns usually feel worse and can force bad decisions (panic selling). It’s a practical way to compare “pain” across periods/strategies.
Caveats
A long drawdown doesn’t guarantee a rebound soon; markets can stay weak longer than expected.
How to read this
What this shows
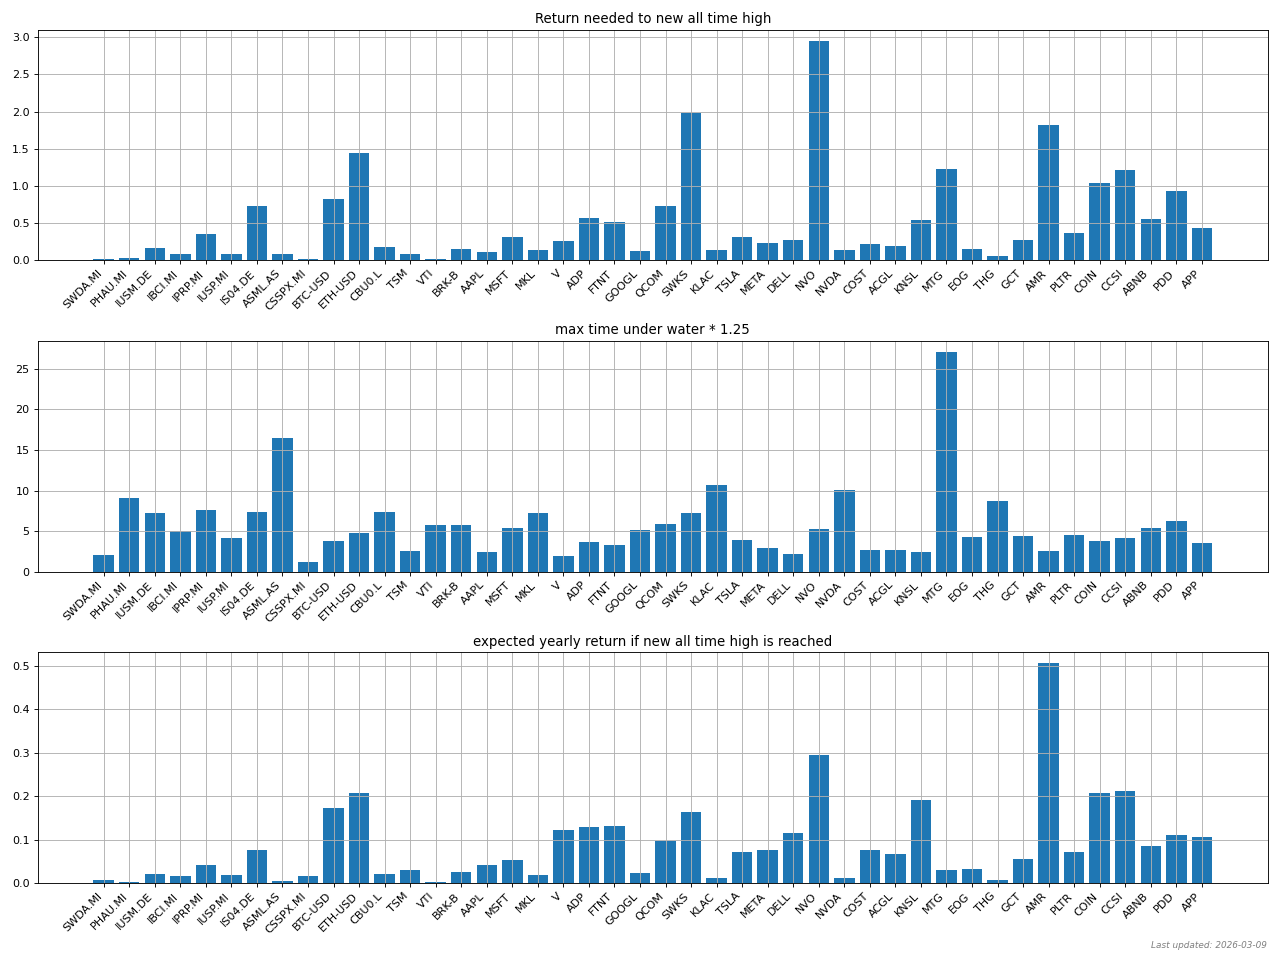
The % return needed to get back to the previous all-time high from today’s level.
How to read
Bigger drawdowns need disproportionately bigger gains to recover (e.g., -50% needs +100%).
Why it matters
Good companies selling at a discount can provide a margin of safety.
Caveats
This is arithmetic, not a forecast. Prices can keep falling, and some companies never recover.
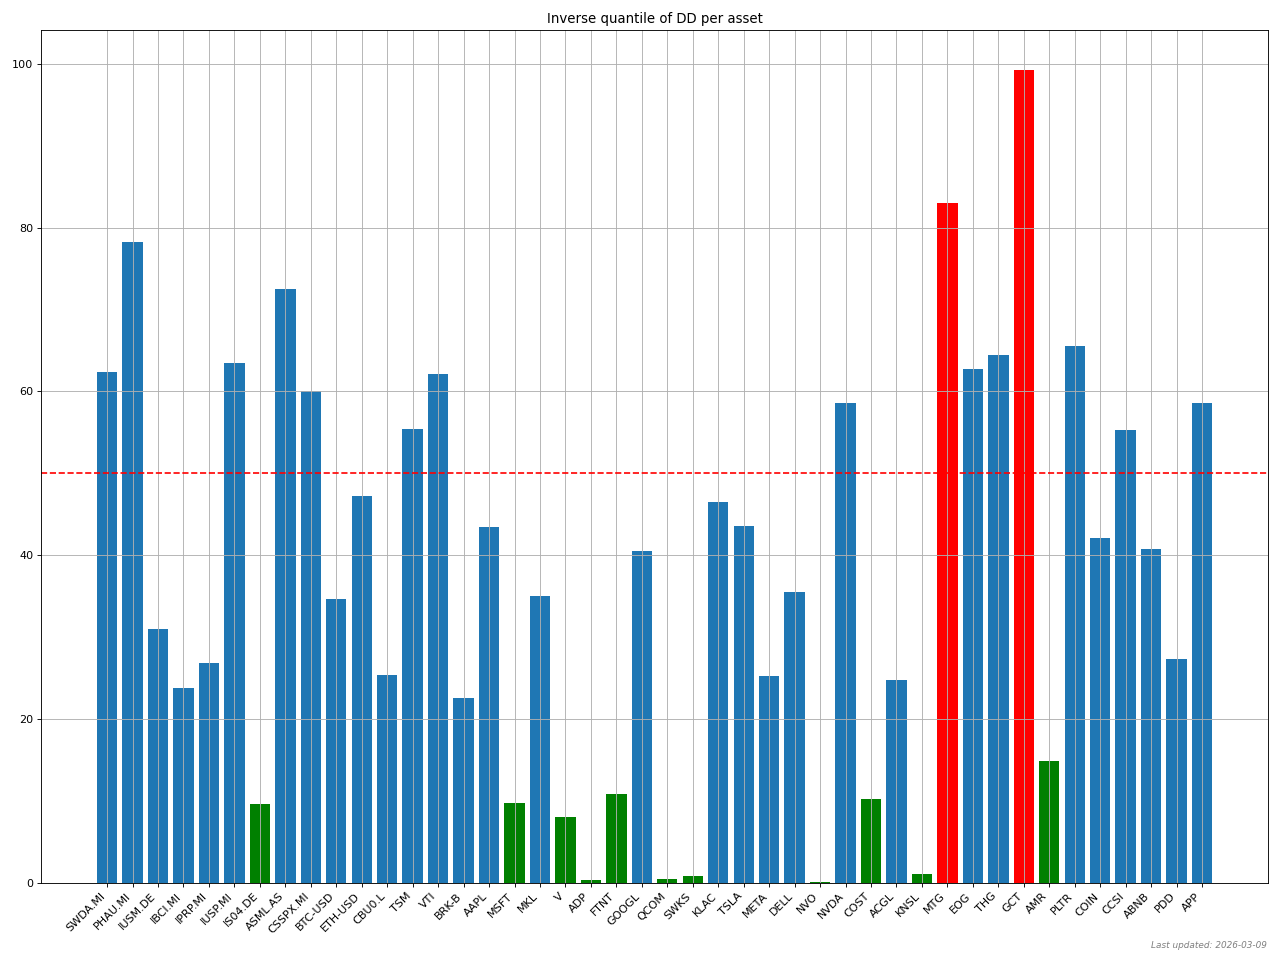
How to read this
What this shows
A 0–100 “how bad is the drawdown?” score vs. that same company’s own history. 100 = near its peak (no drawdown), 0 = near its worst historical drawdown.
How to read
Lower = more stretched vs. history. Use it to compare “stress level” across stocks on the same scale.
Why it matters
If fundamentals are intact, deep drawdowns can sometimes offer better entry points than buying near peaks.
Caveats
“Cheap” can get cheaper. A low score is not a buy signal by itself—bad businesses can stay down or go to zero.
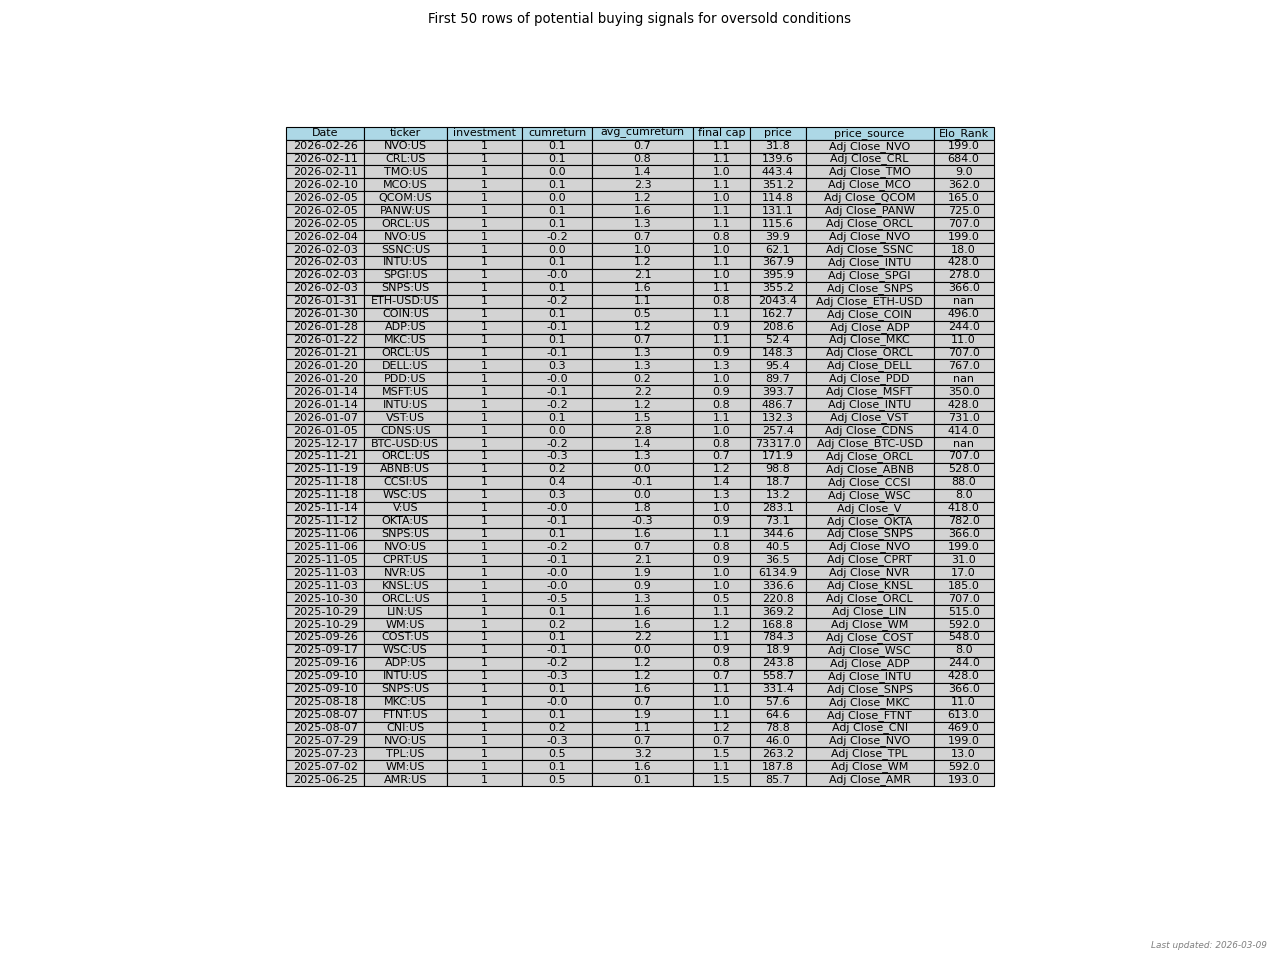
How to read this
What this shows
A rule-based “oversold” indicator. It measures sustained downside pressure and highlights moments where past data suggests the odds of a rebound improved.
How to read
Treat highlighted points as “check this stock now”, not an automatic buy. Combine with fundamentals and position sizing.
Why it matters
Removes emotion: it gives consistent criteria for when to look for entries during sell-offs.
Caveats
Signals can be early and keep triggering in a downtrend. Always assume the next signal can fail.
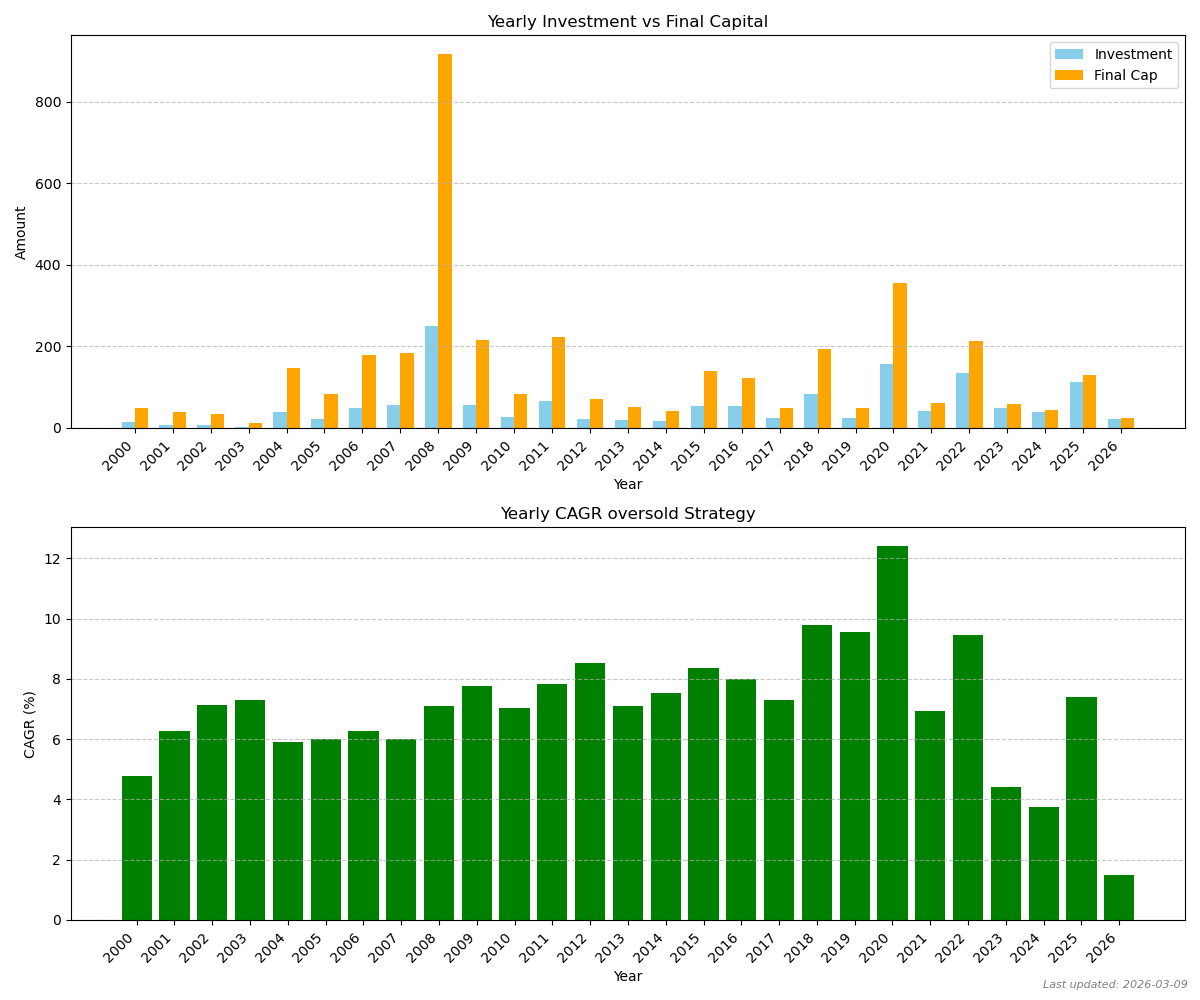
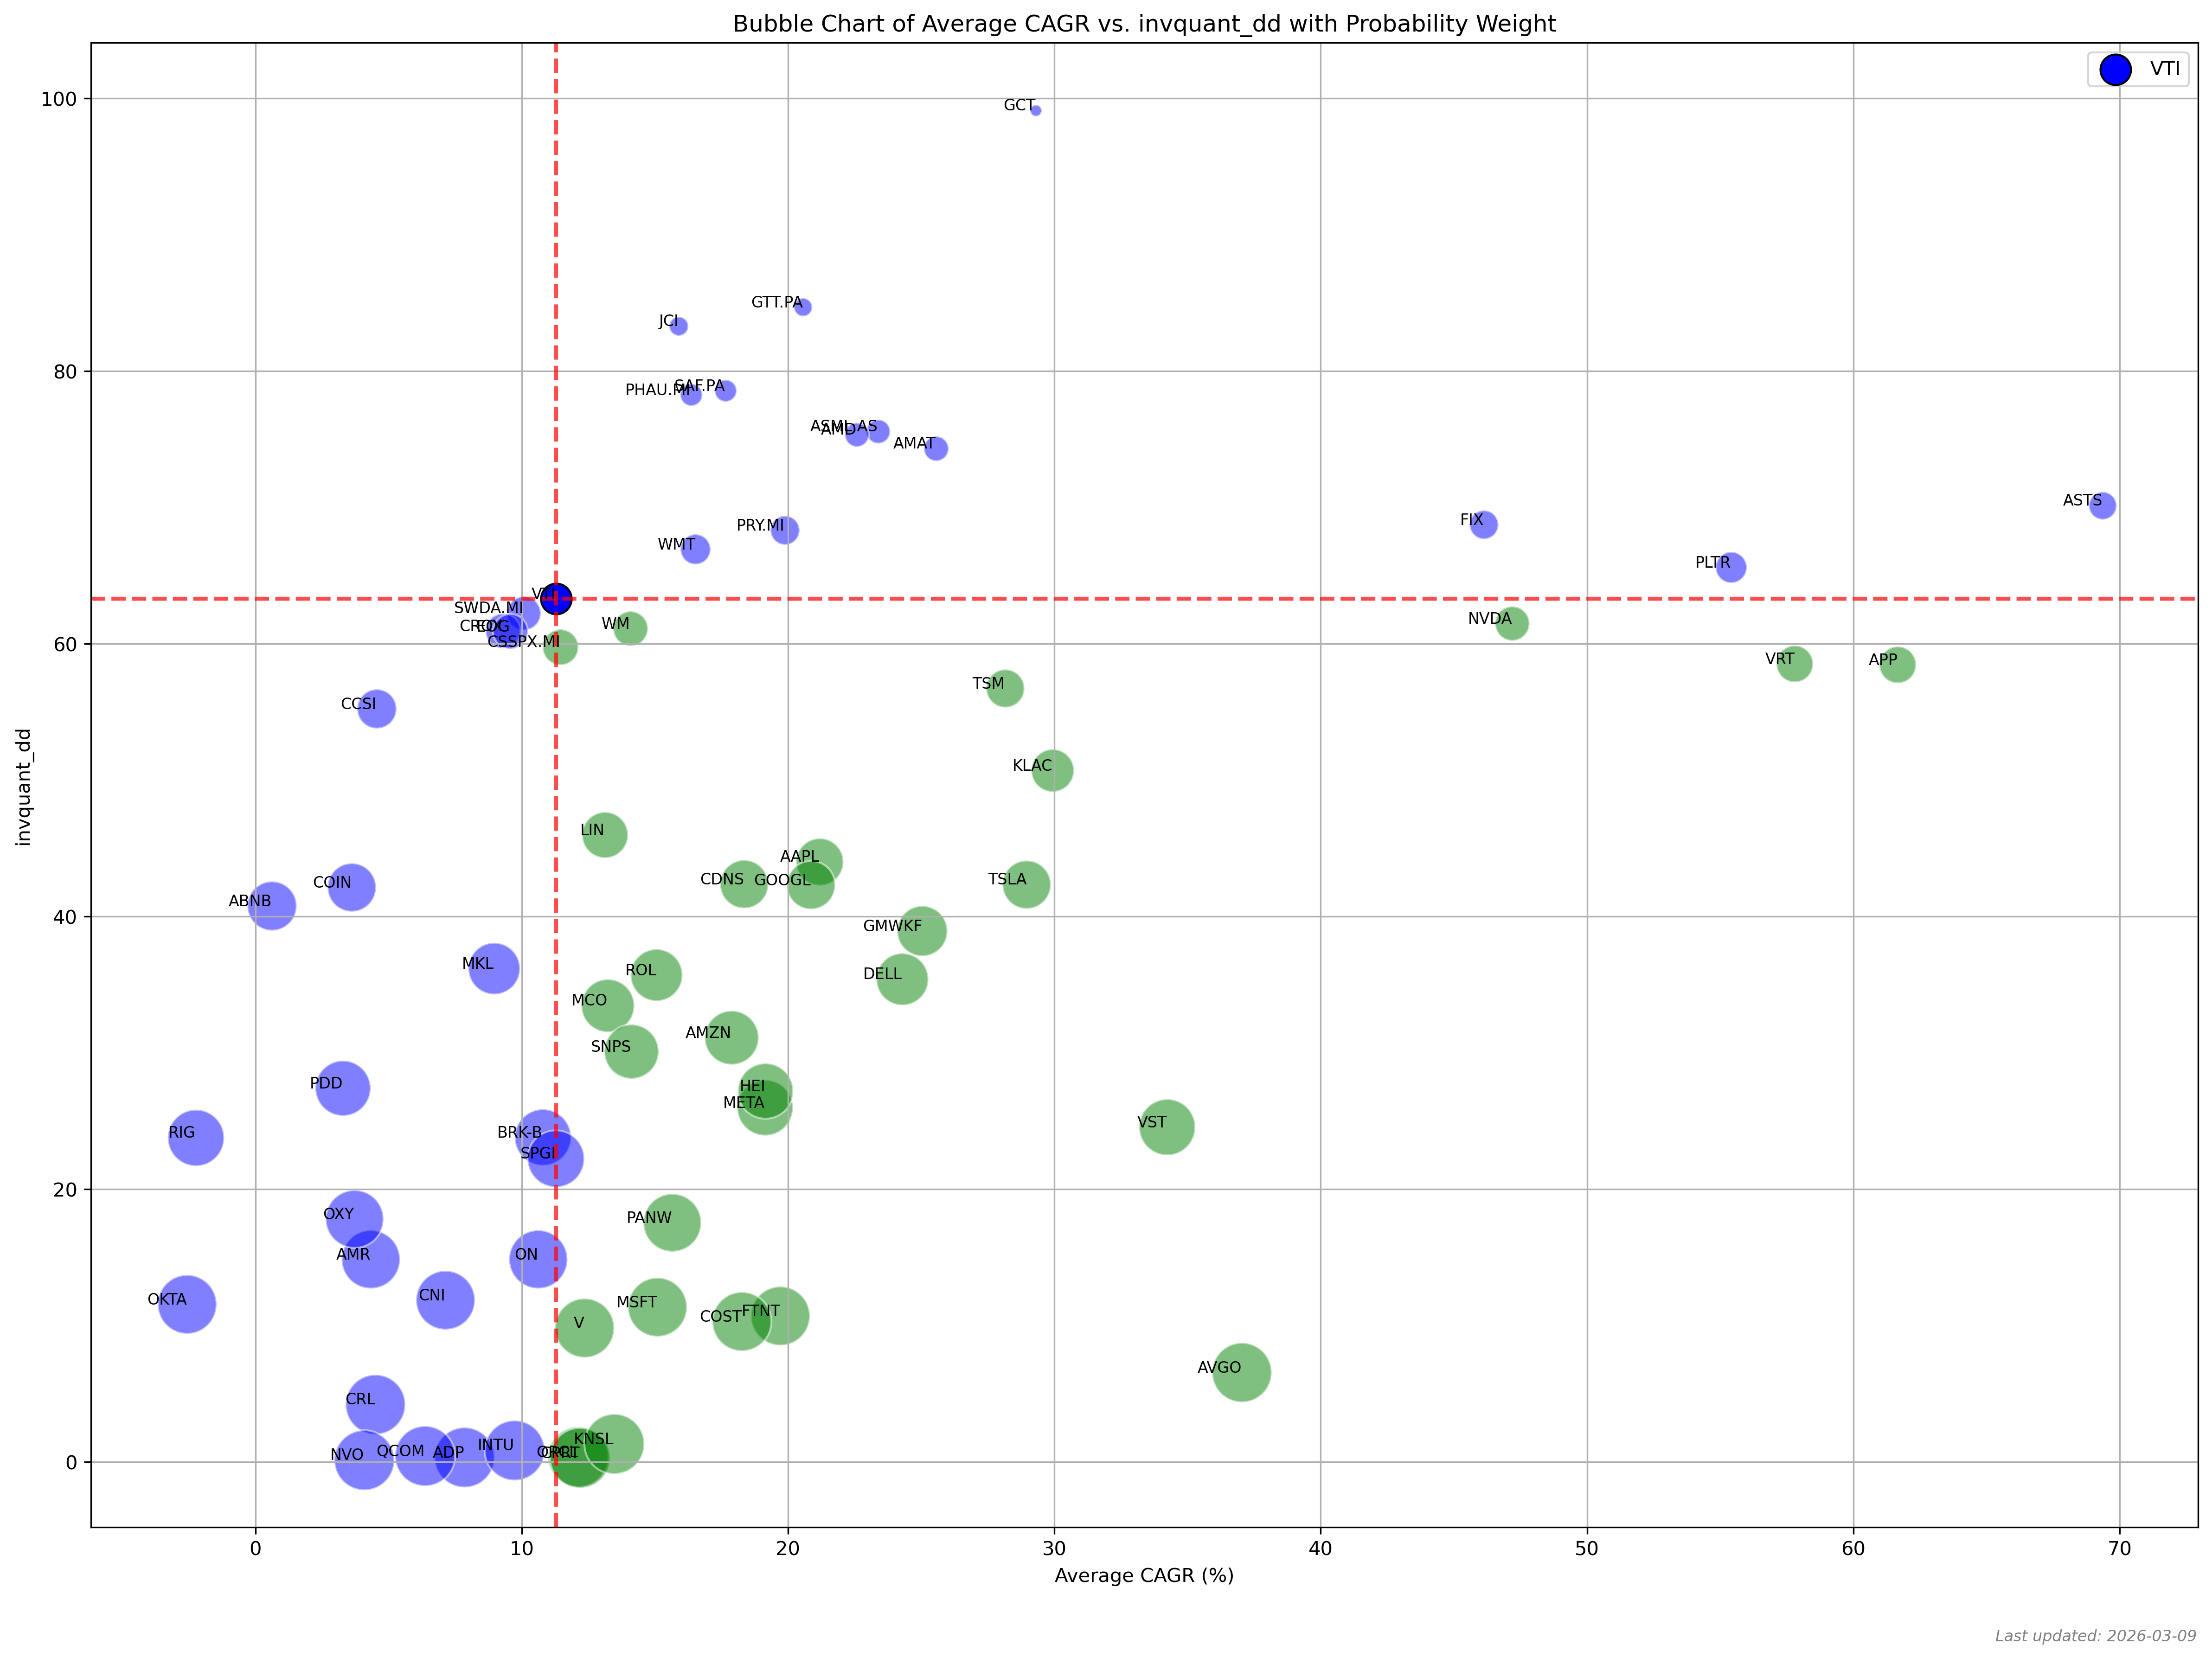
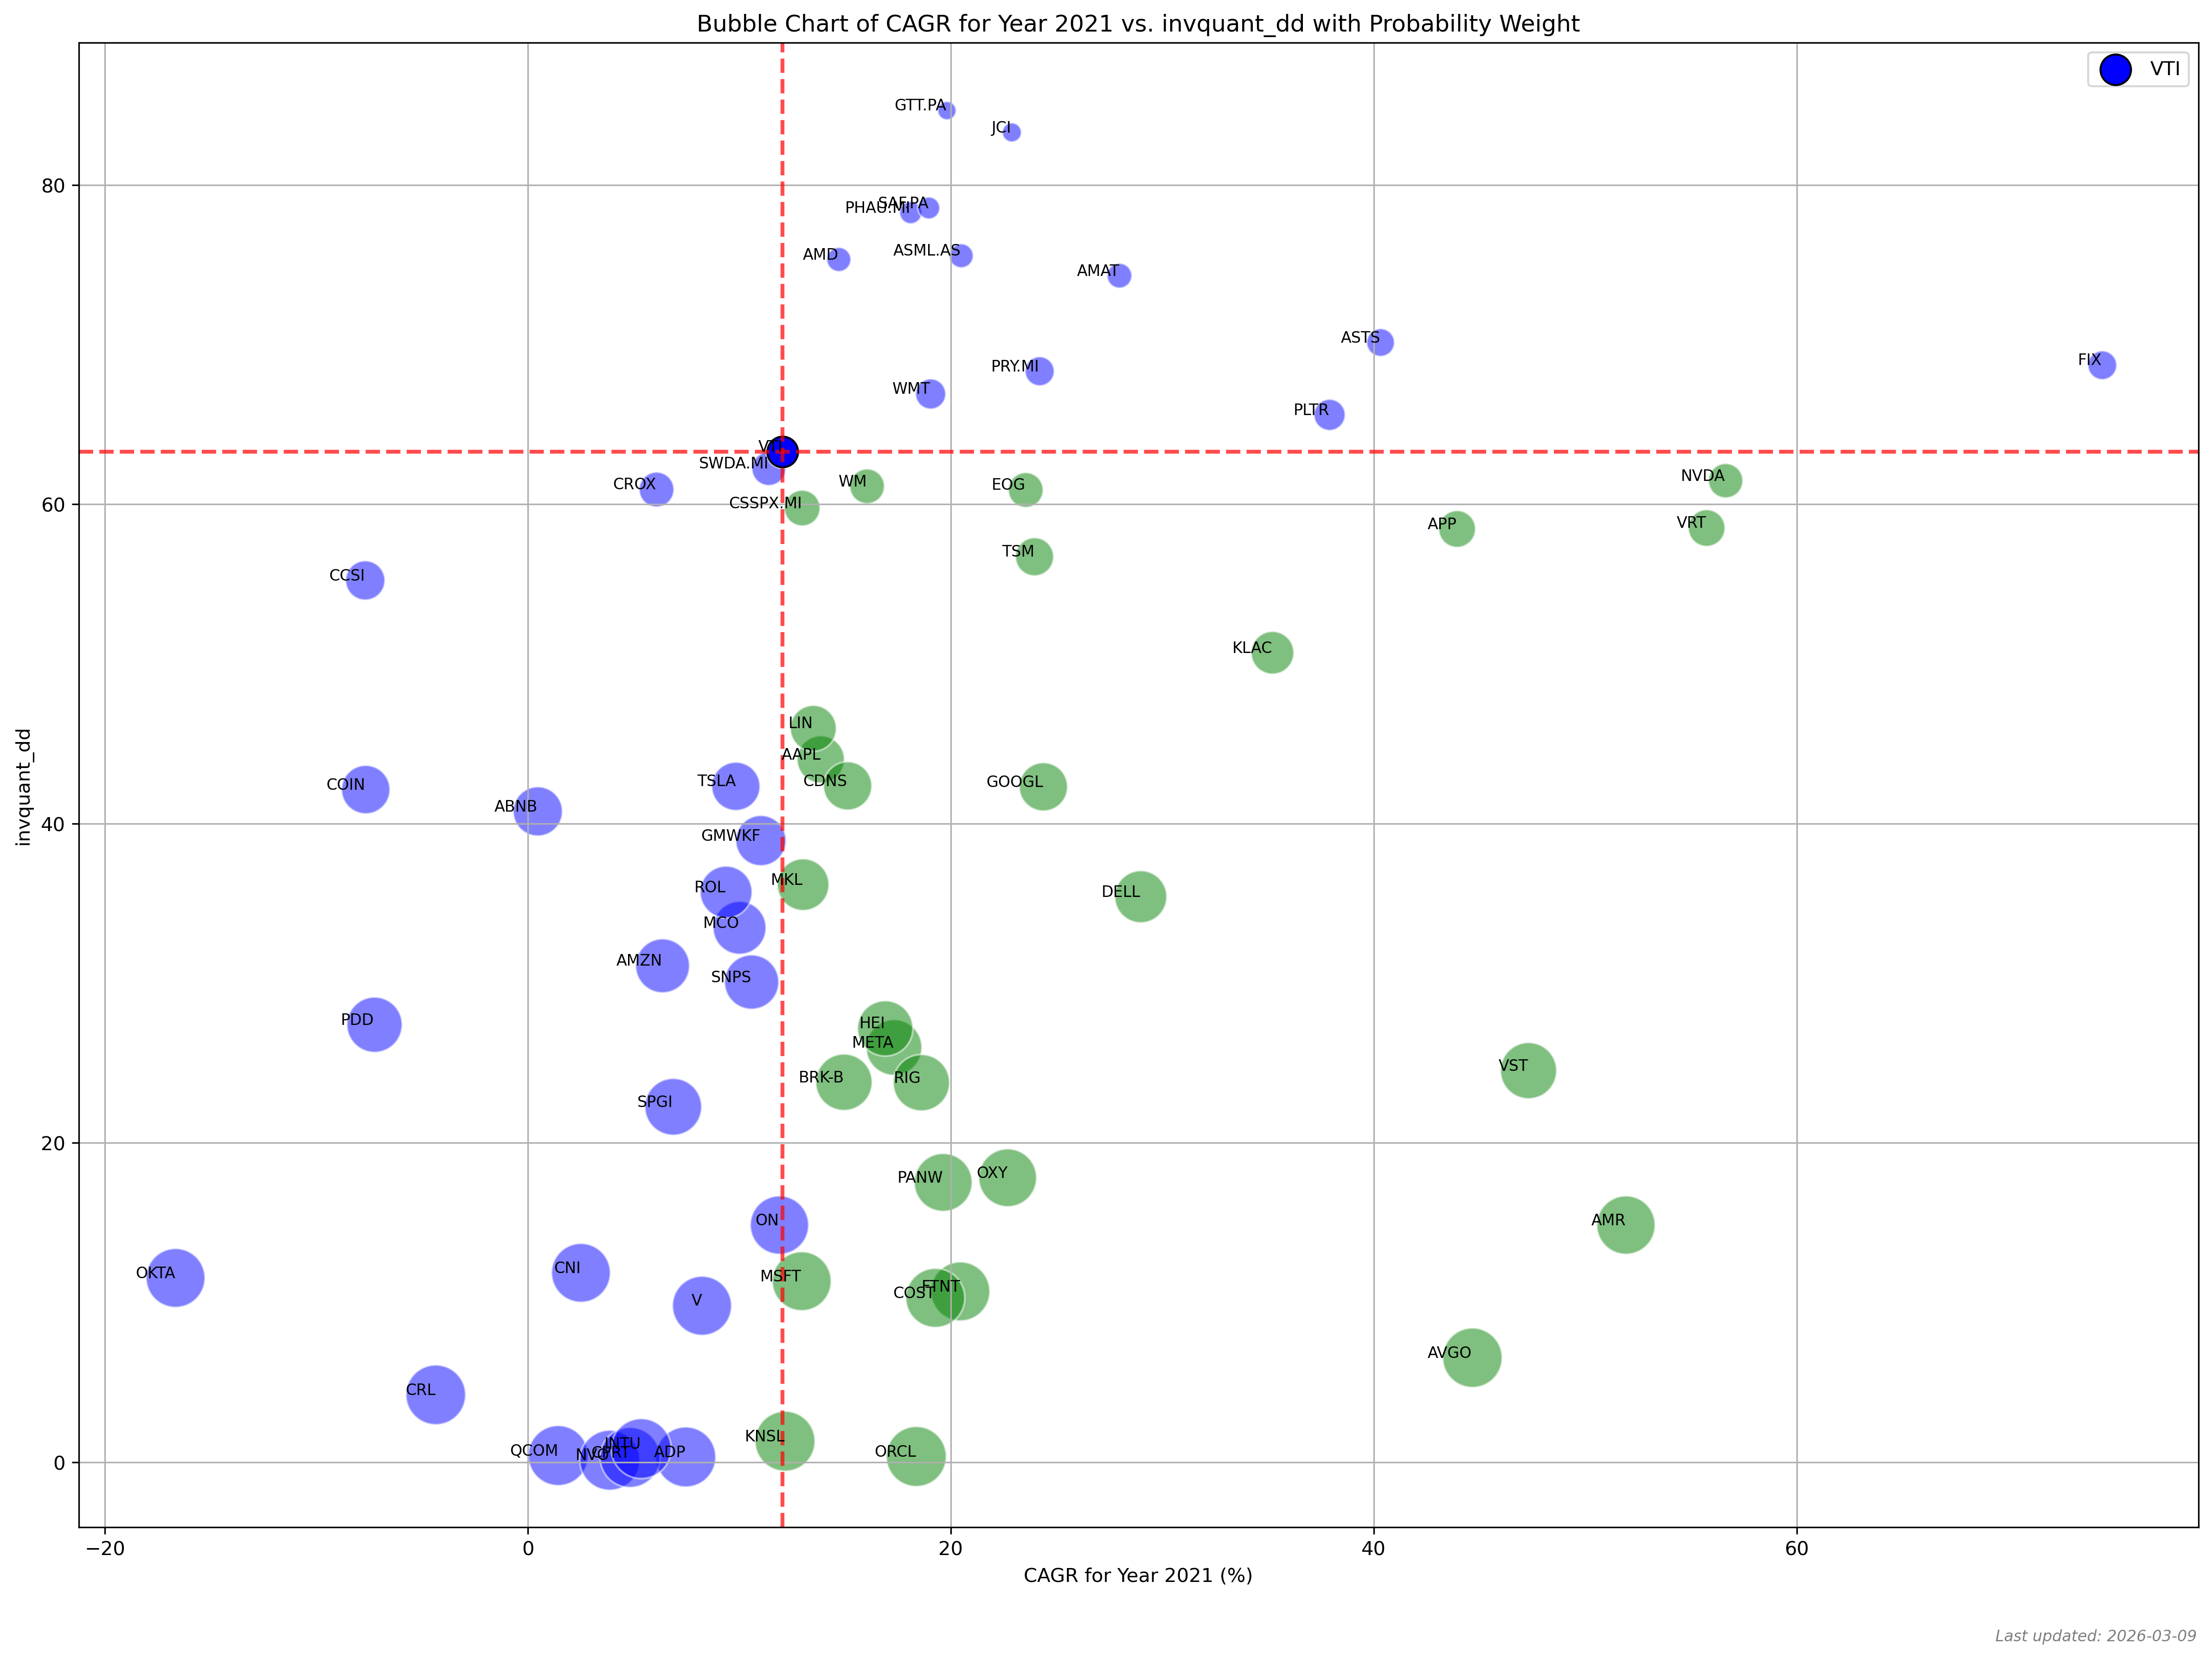
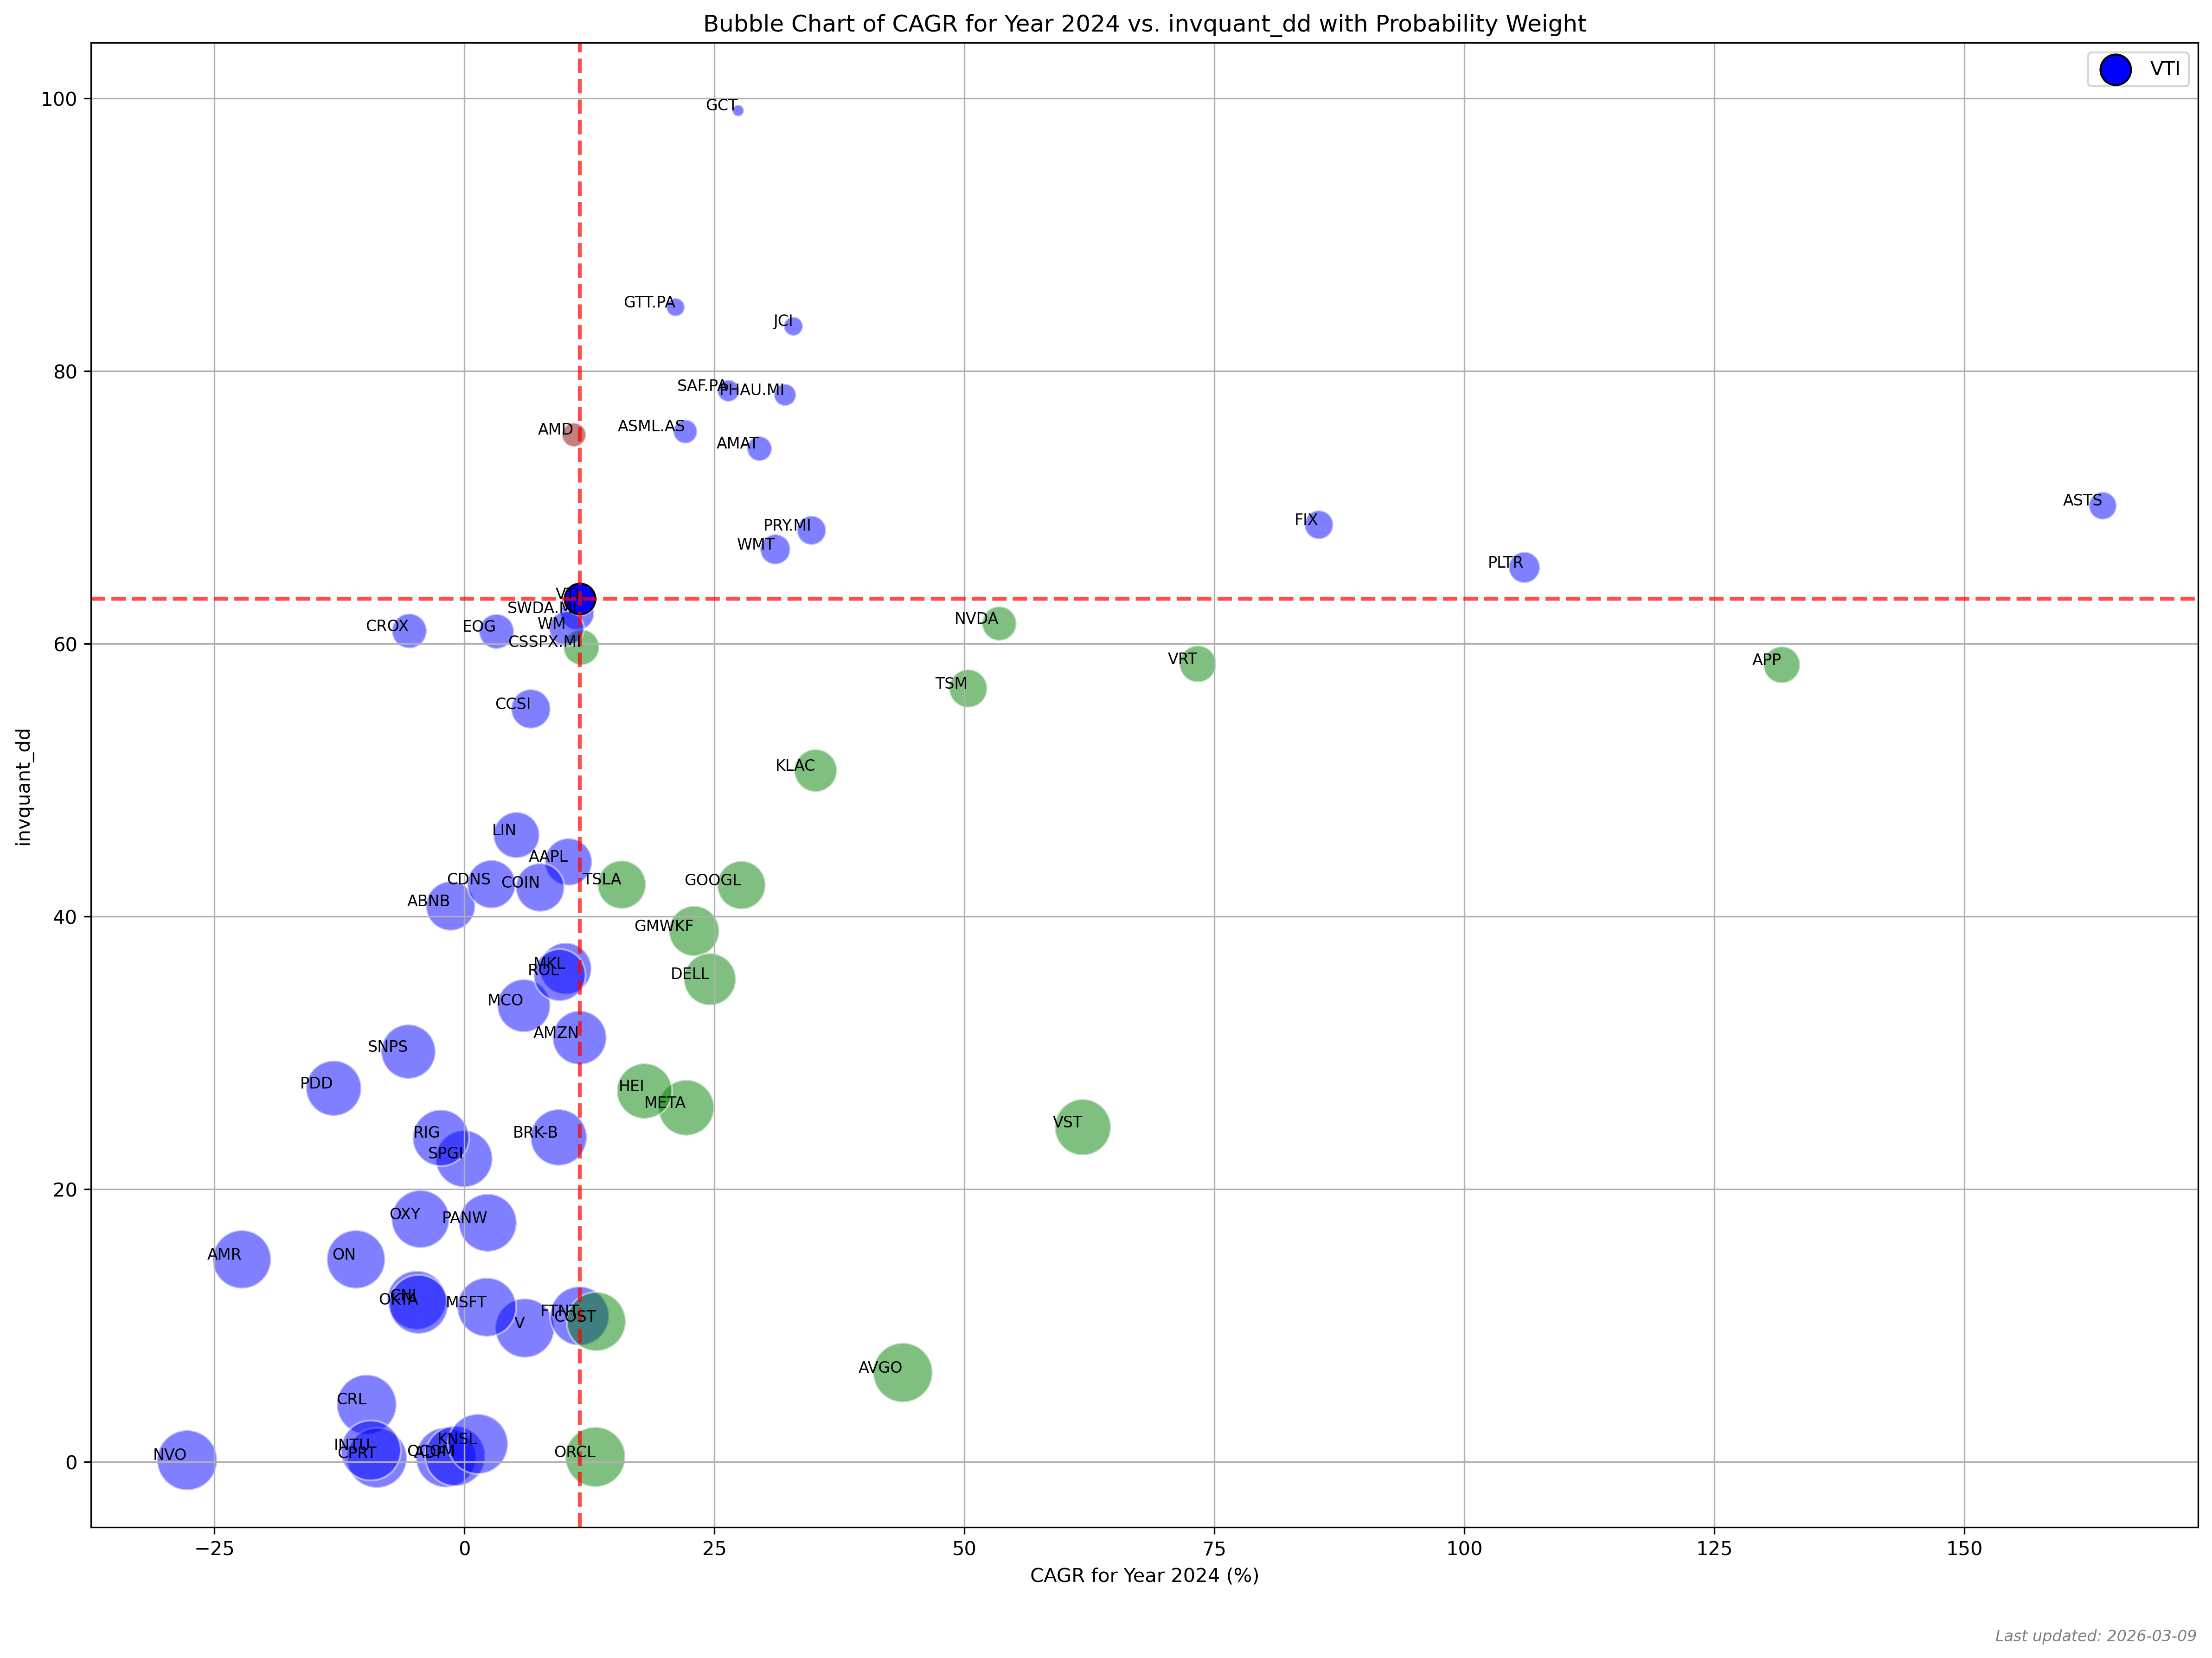
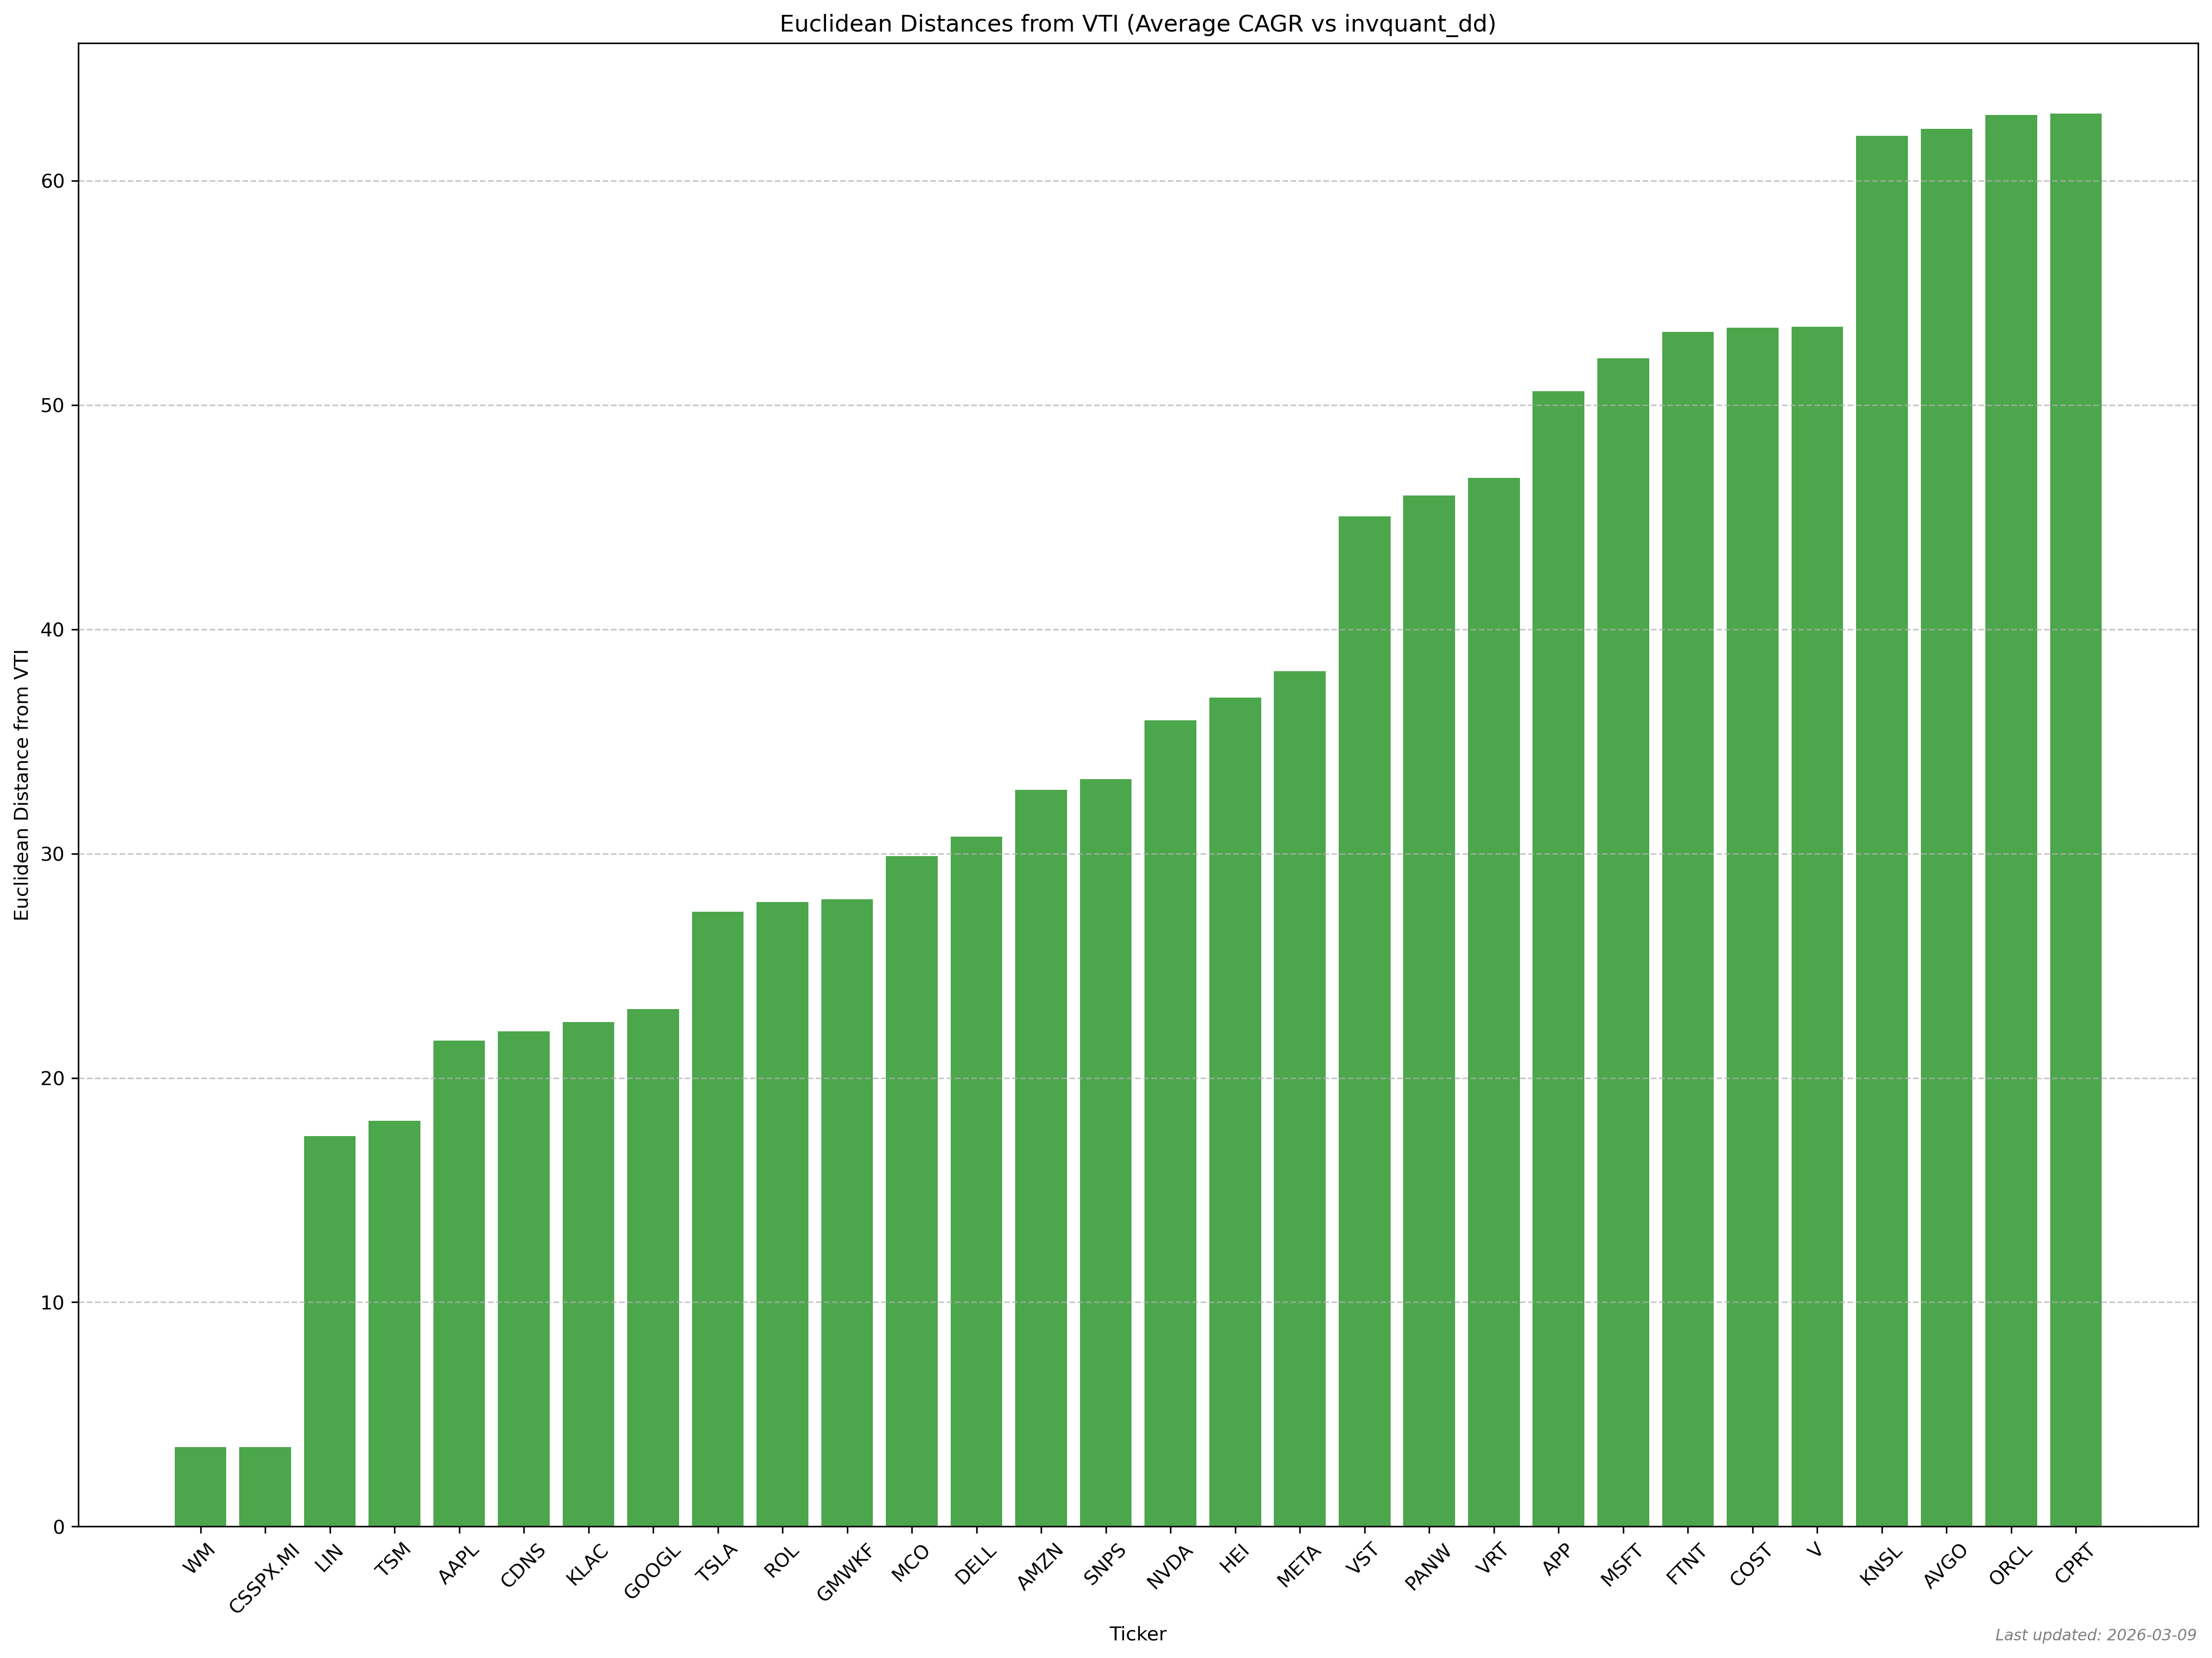
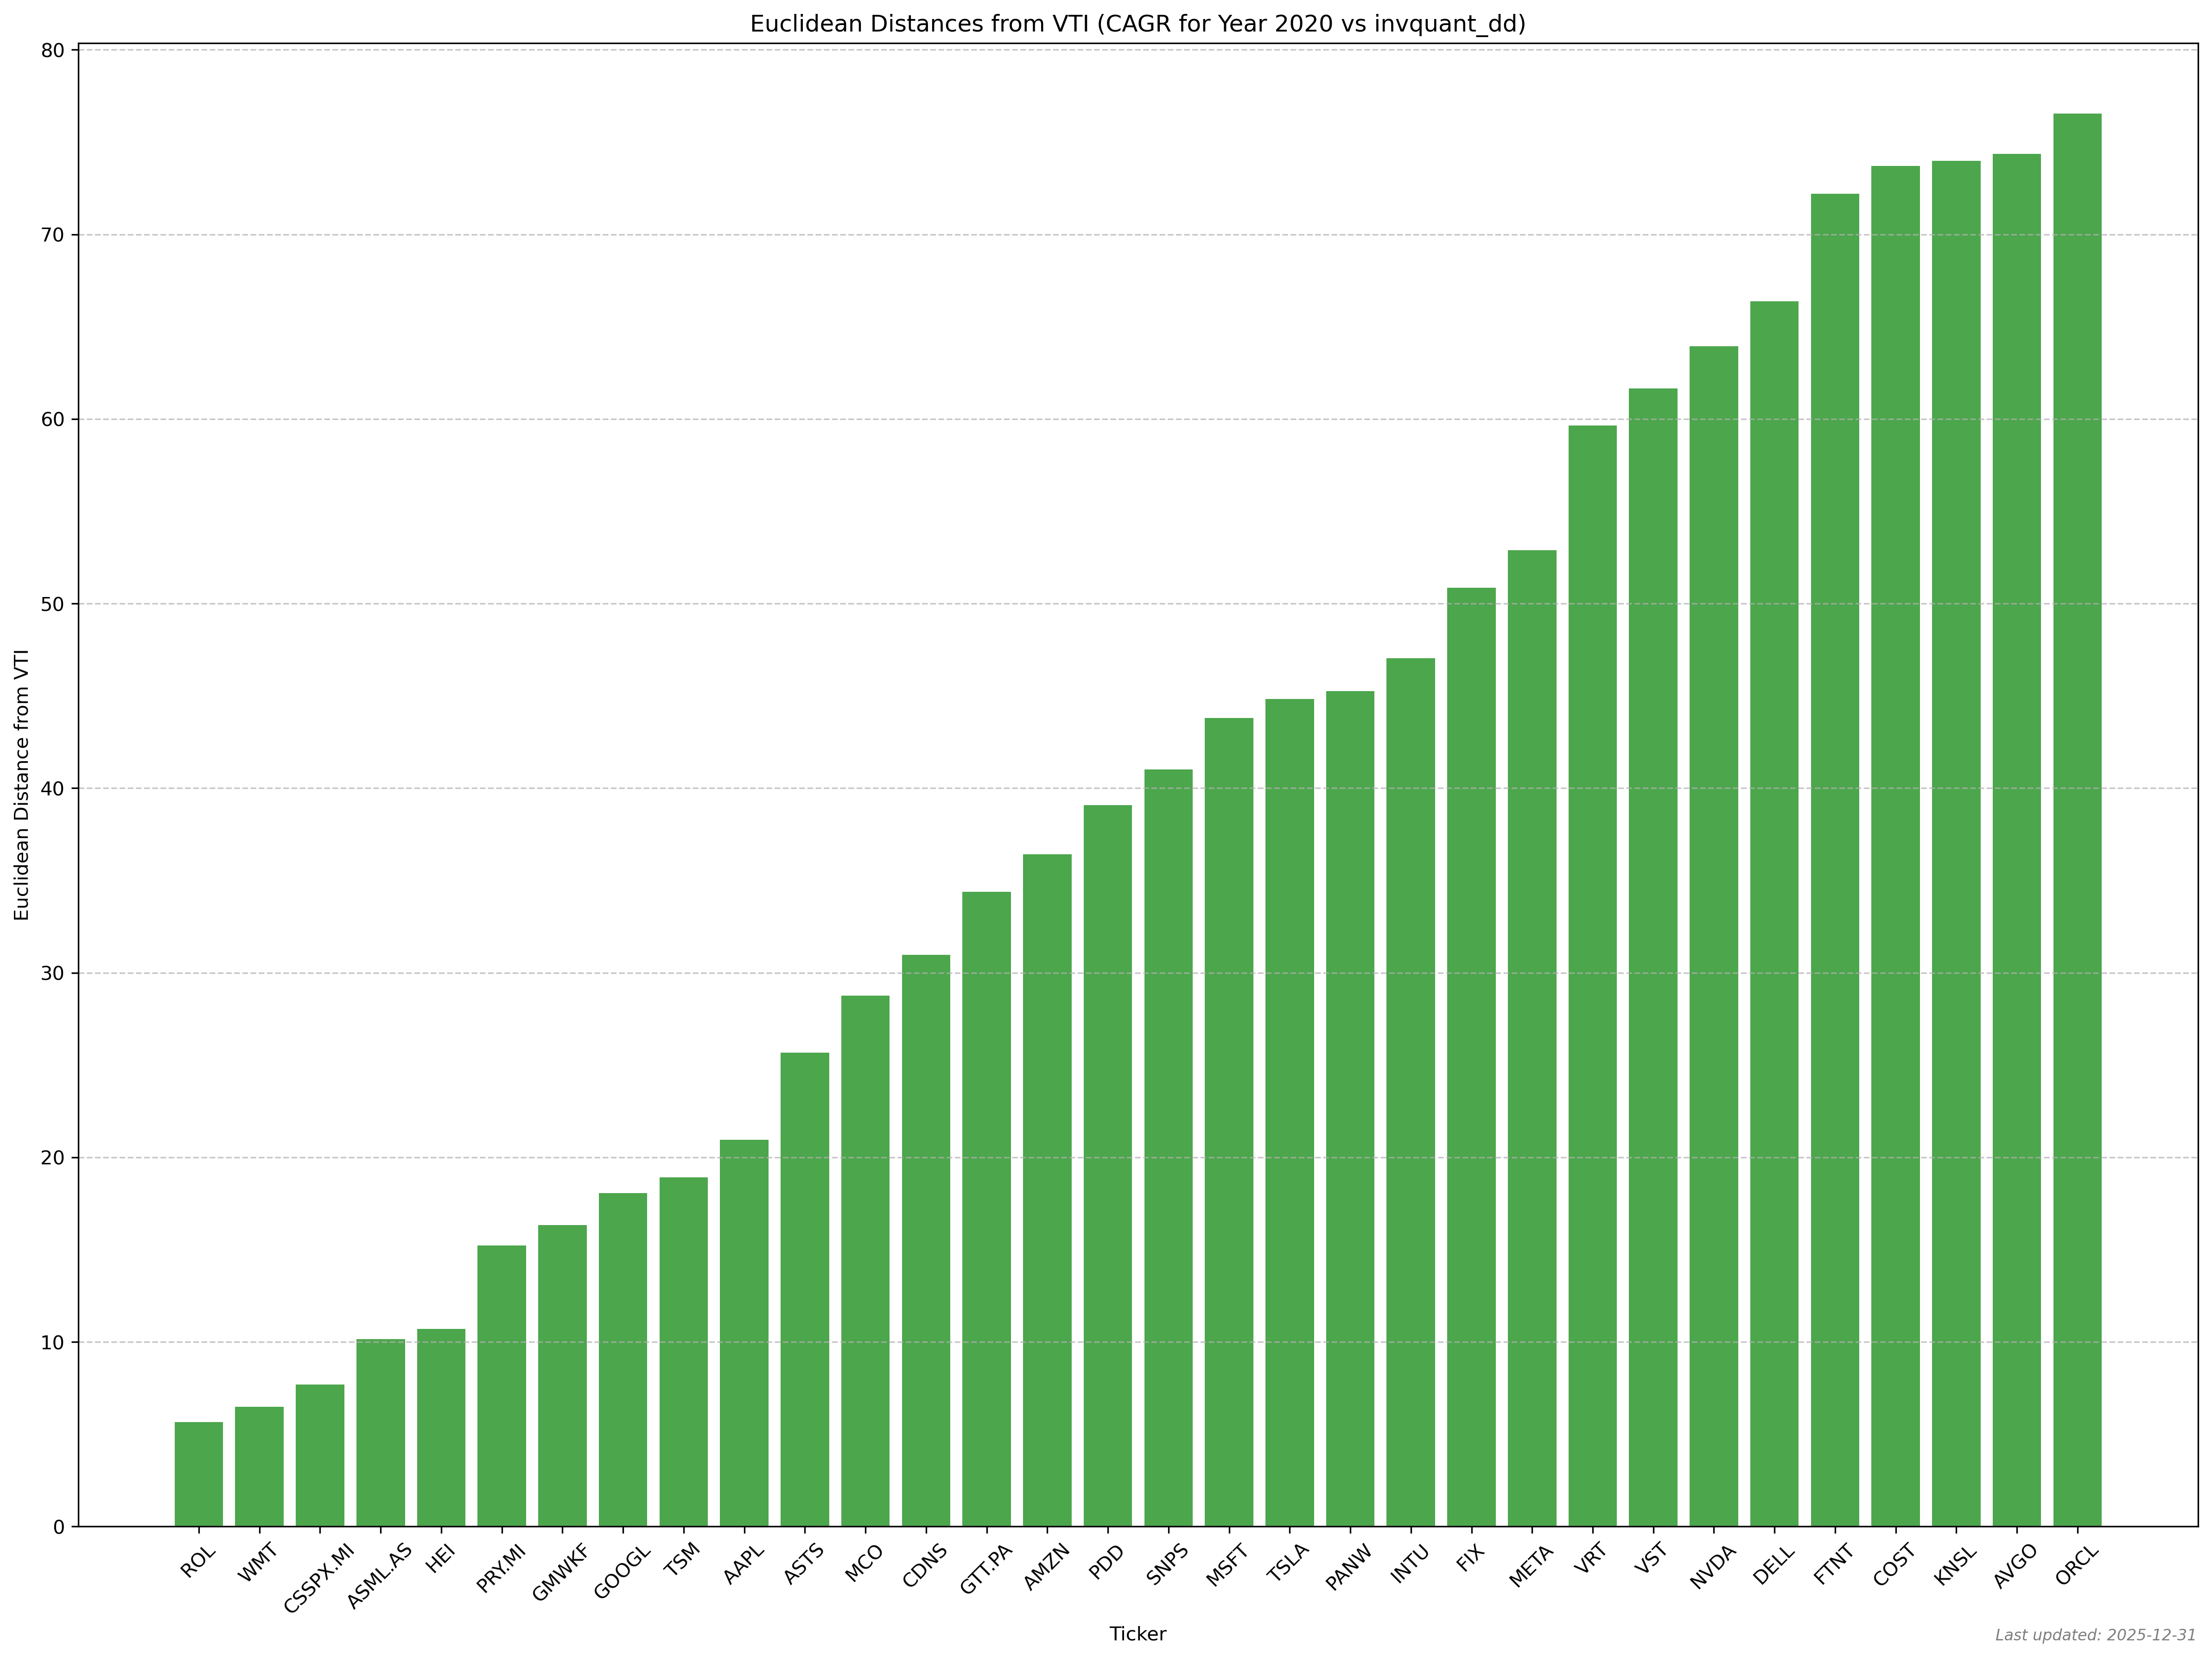
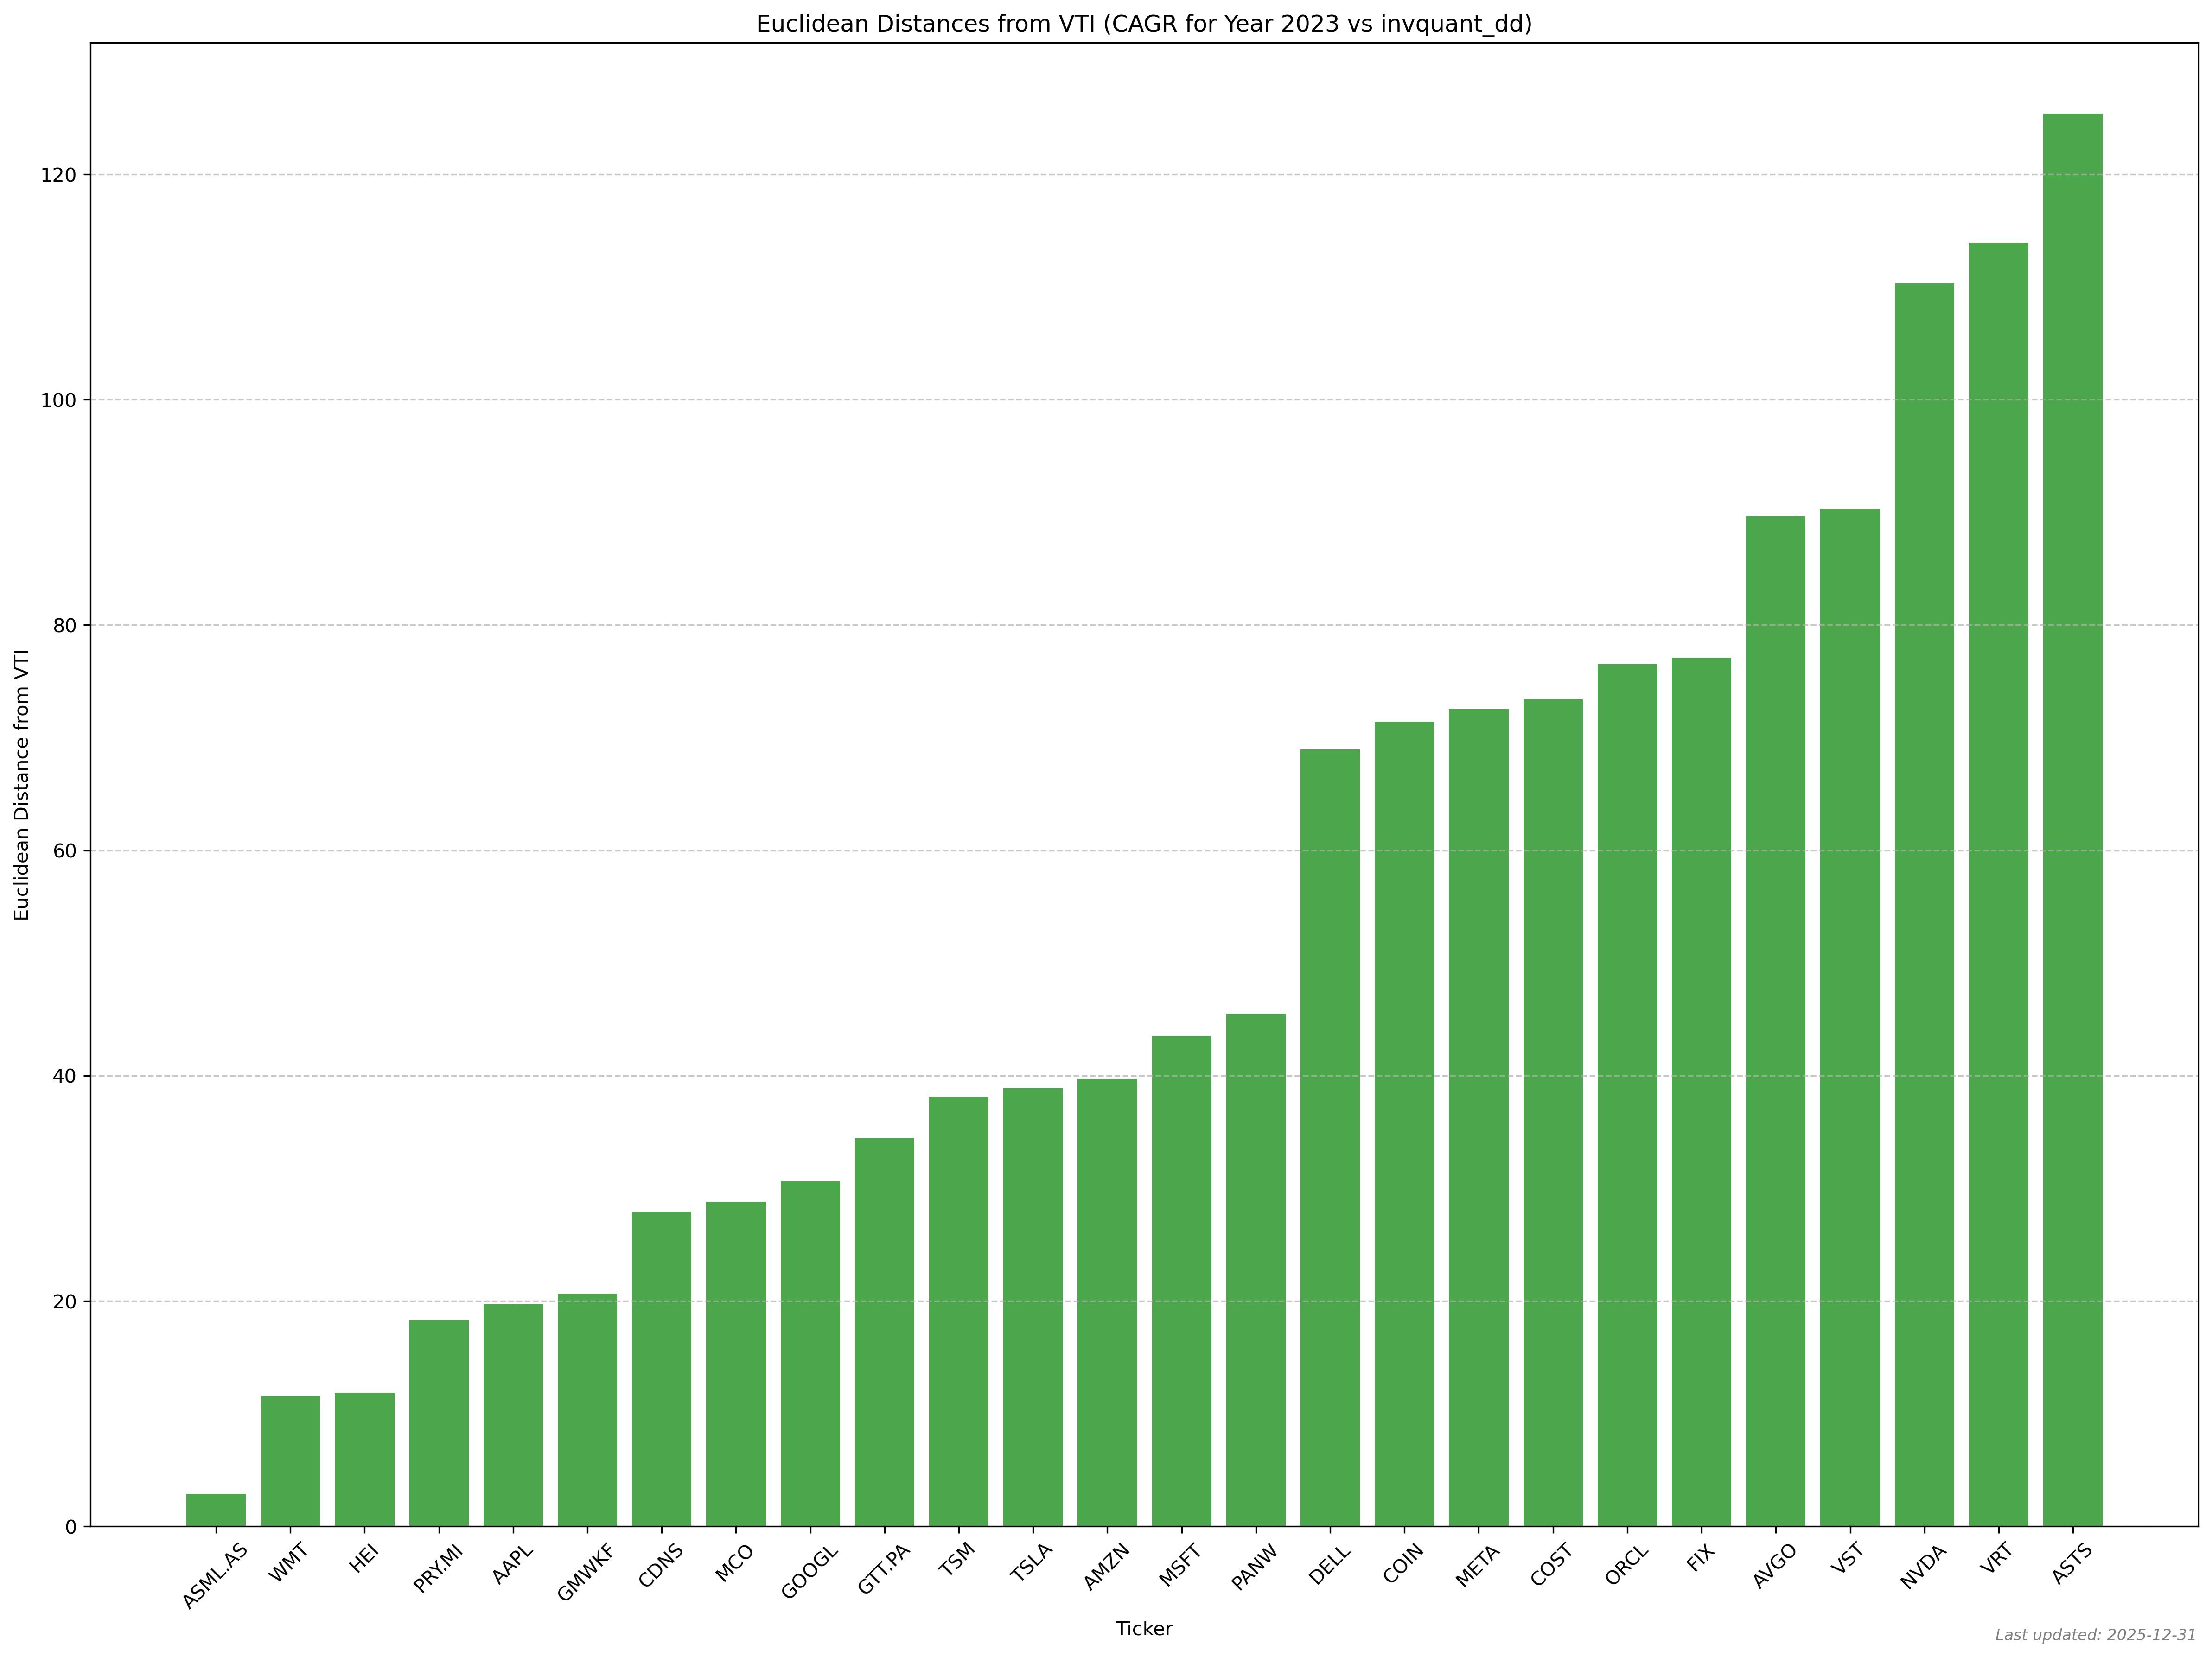
How to read this
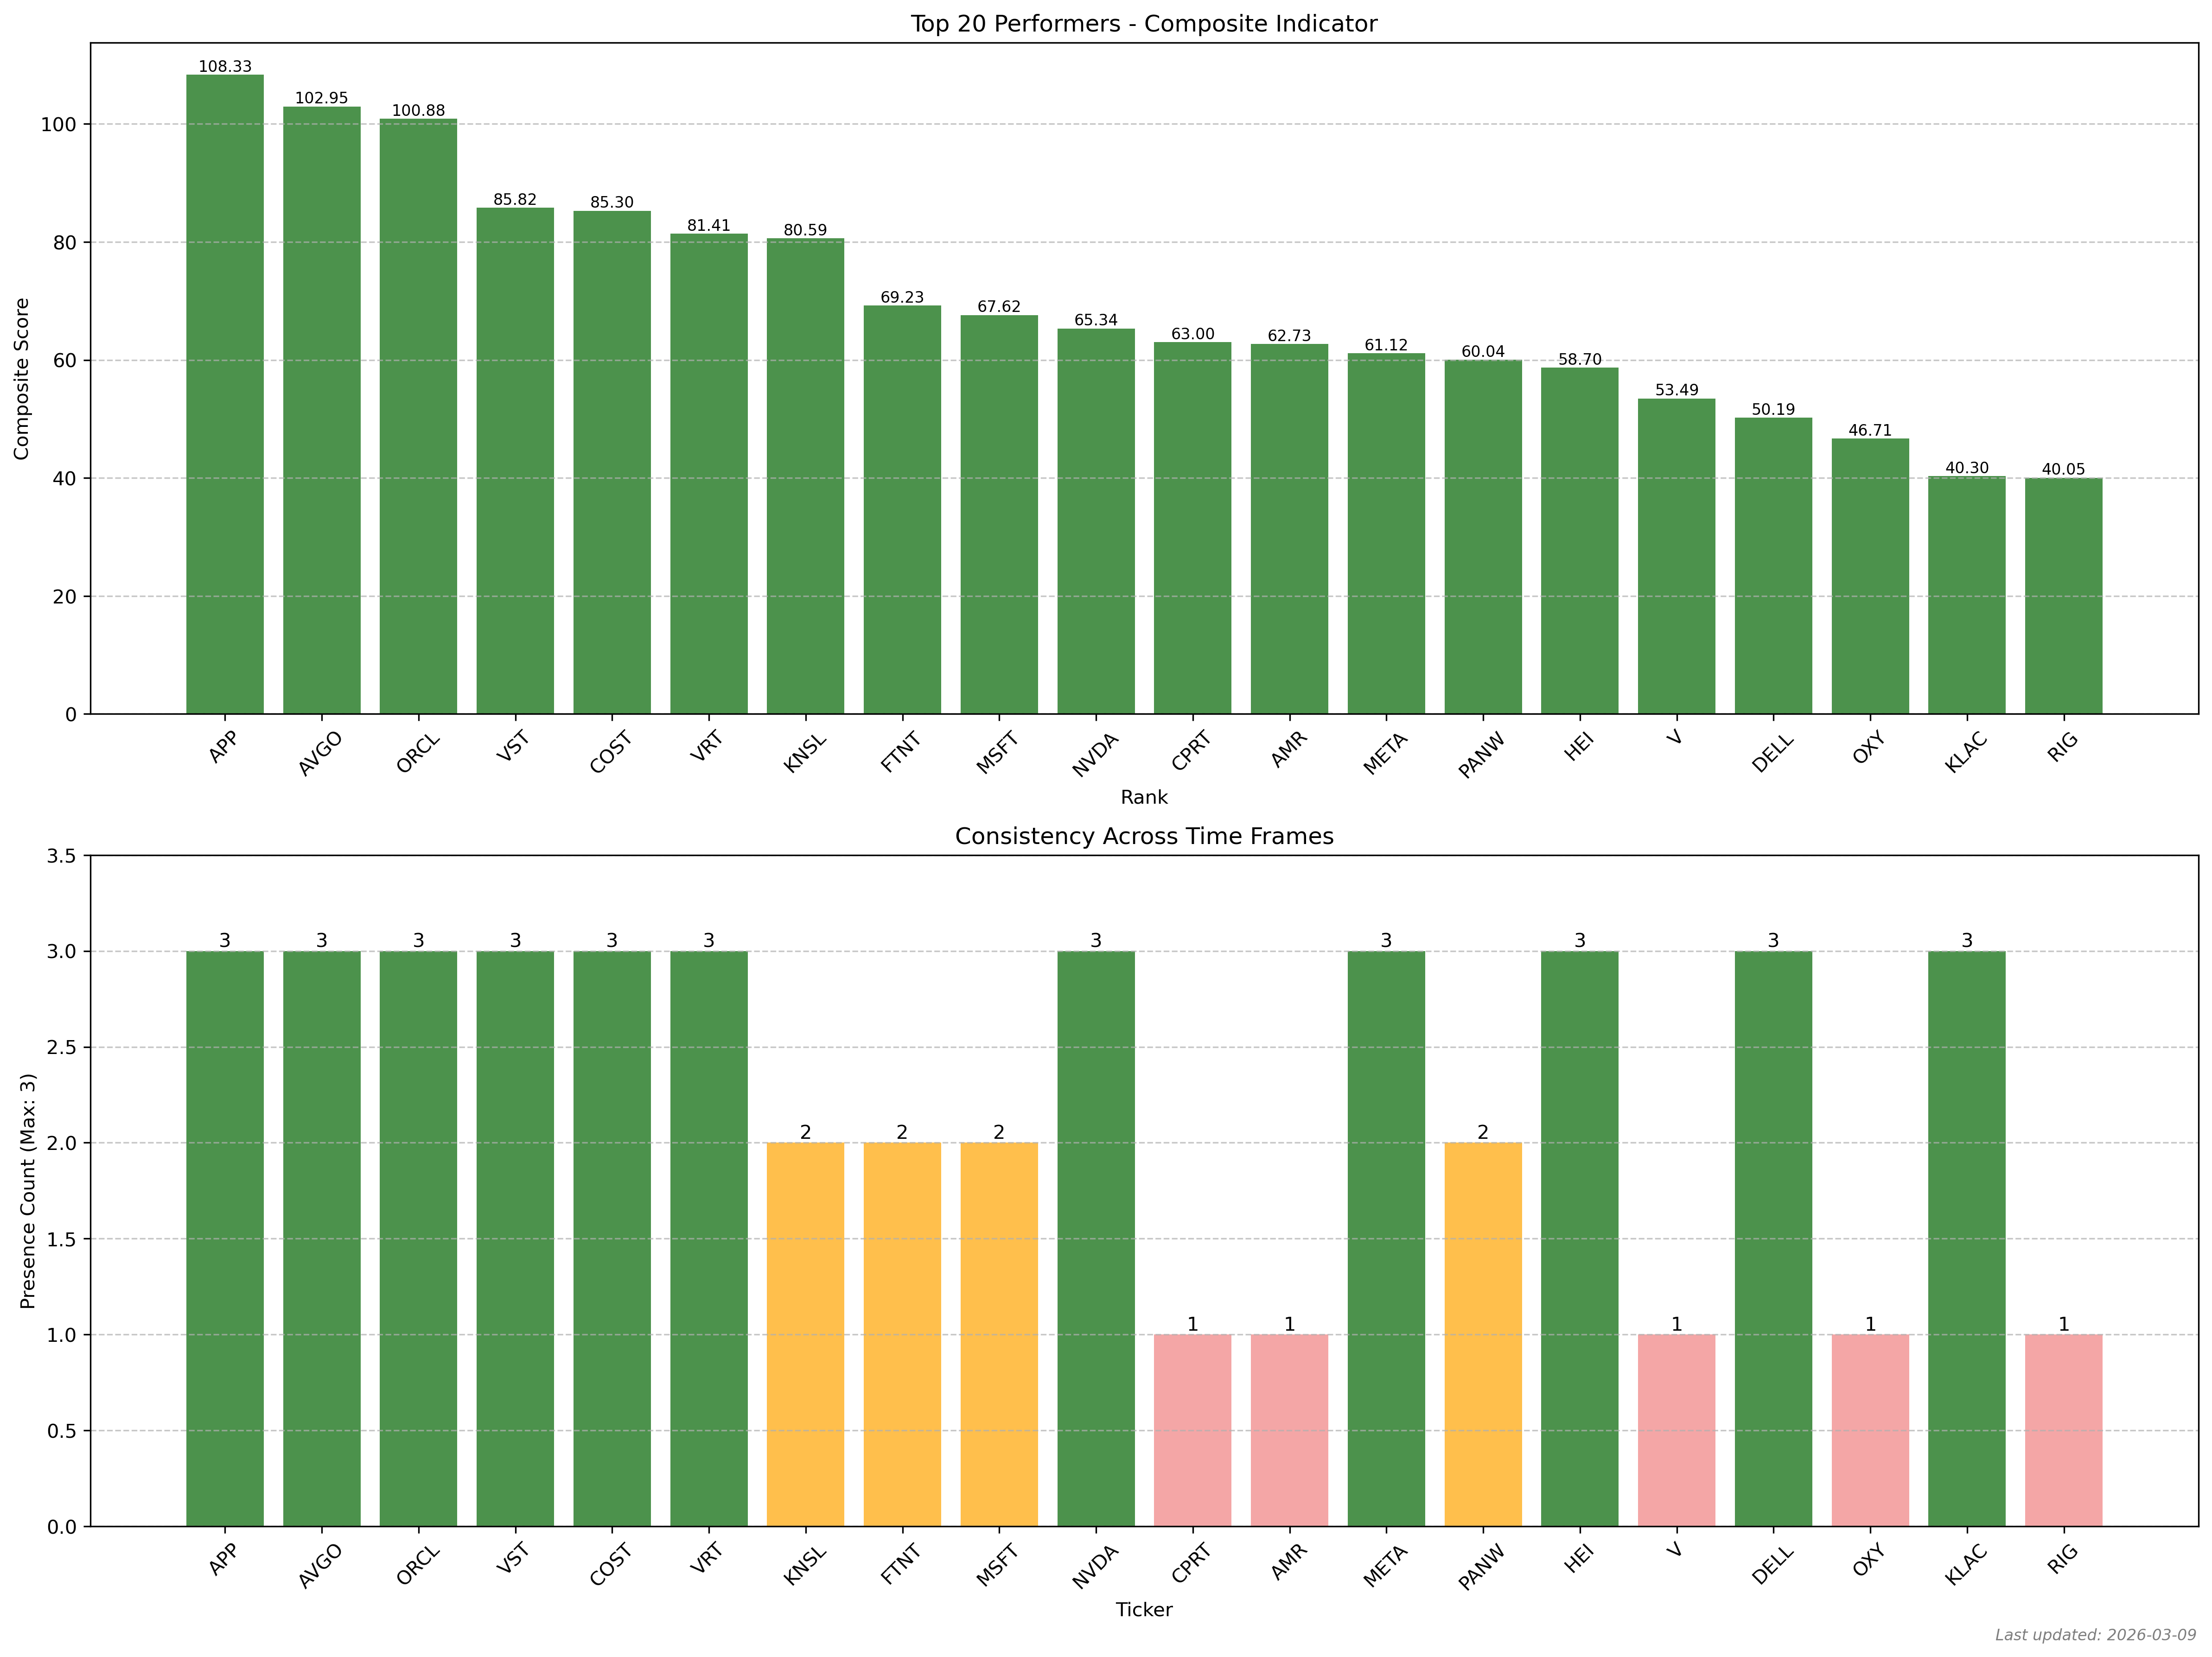
What this shows
One score that combines multiple signals (returns, drawdowns, and time effects). Higher = “better overall” across the metrics used.
How to read
Higher composite → stronger multi-metric profile.
Why it matters
A single metric can be misleading. This helps balance “high return” against “high risk” in one view.
Caveats
The score depends on how each metric is weighted. Treat it as a ranking tool, not a guarantee.
US Stock Market Index Statistics
How to read this
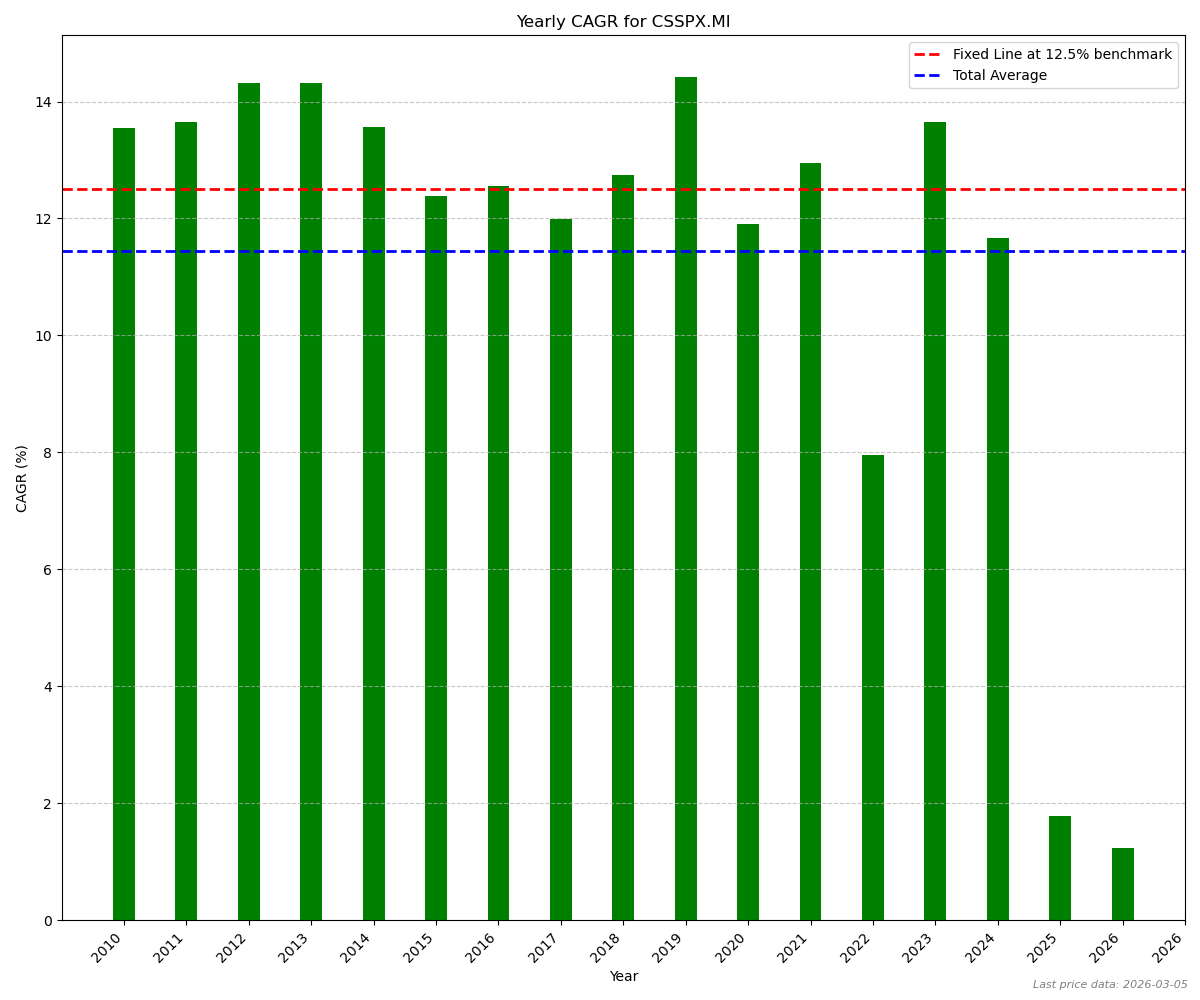
What this shows
A benchmark CAGR snapshot for an S&P 500 UCITS tracker (in EUR). Think of it as “what a simple index investment delivered”.
How to read
Higher CAGR is better, but also look for consistency across years (big swings usually mean higher uncertainty).
Why it matters
Use it to sanity-check your strategy: if a strategy can’t beat the index after costs, it’s often not worth the extra complexity.
Caveats
Past performance ≠ future returns. Also, results depend on currency (EUR vs USD) and the chosen time window.
How to read this
What this shows
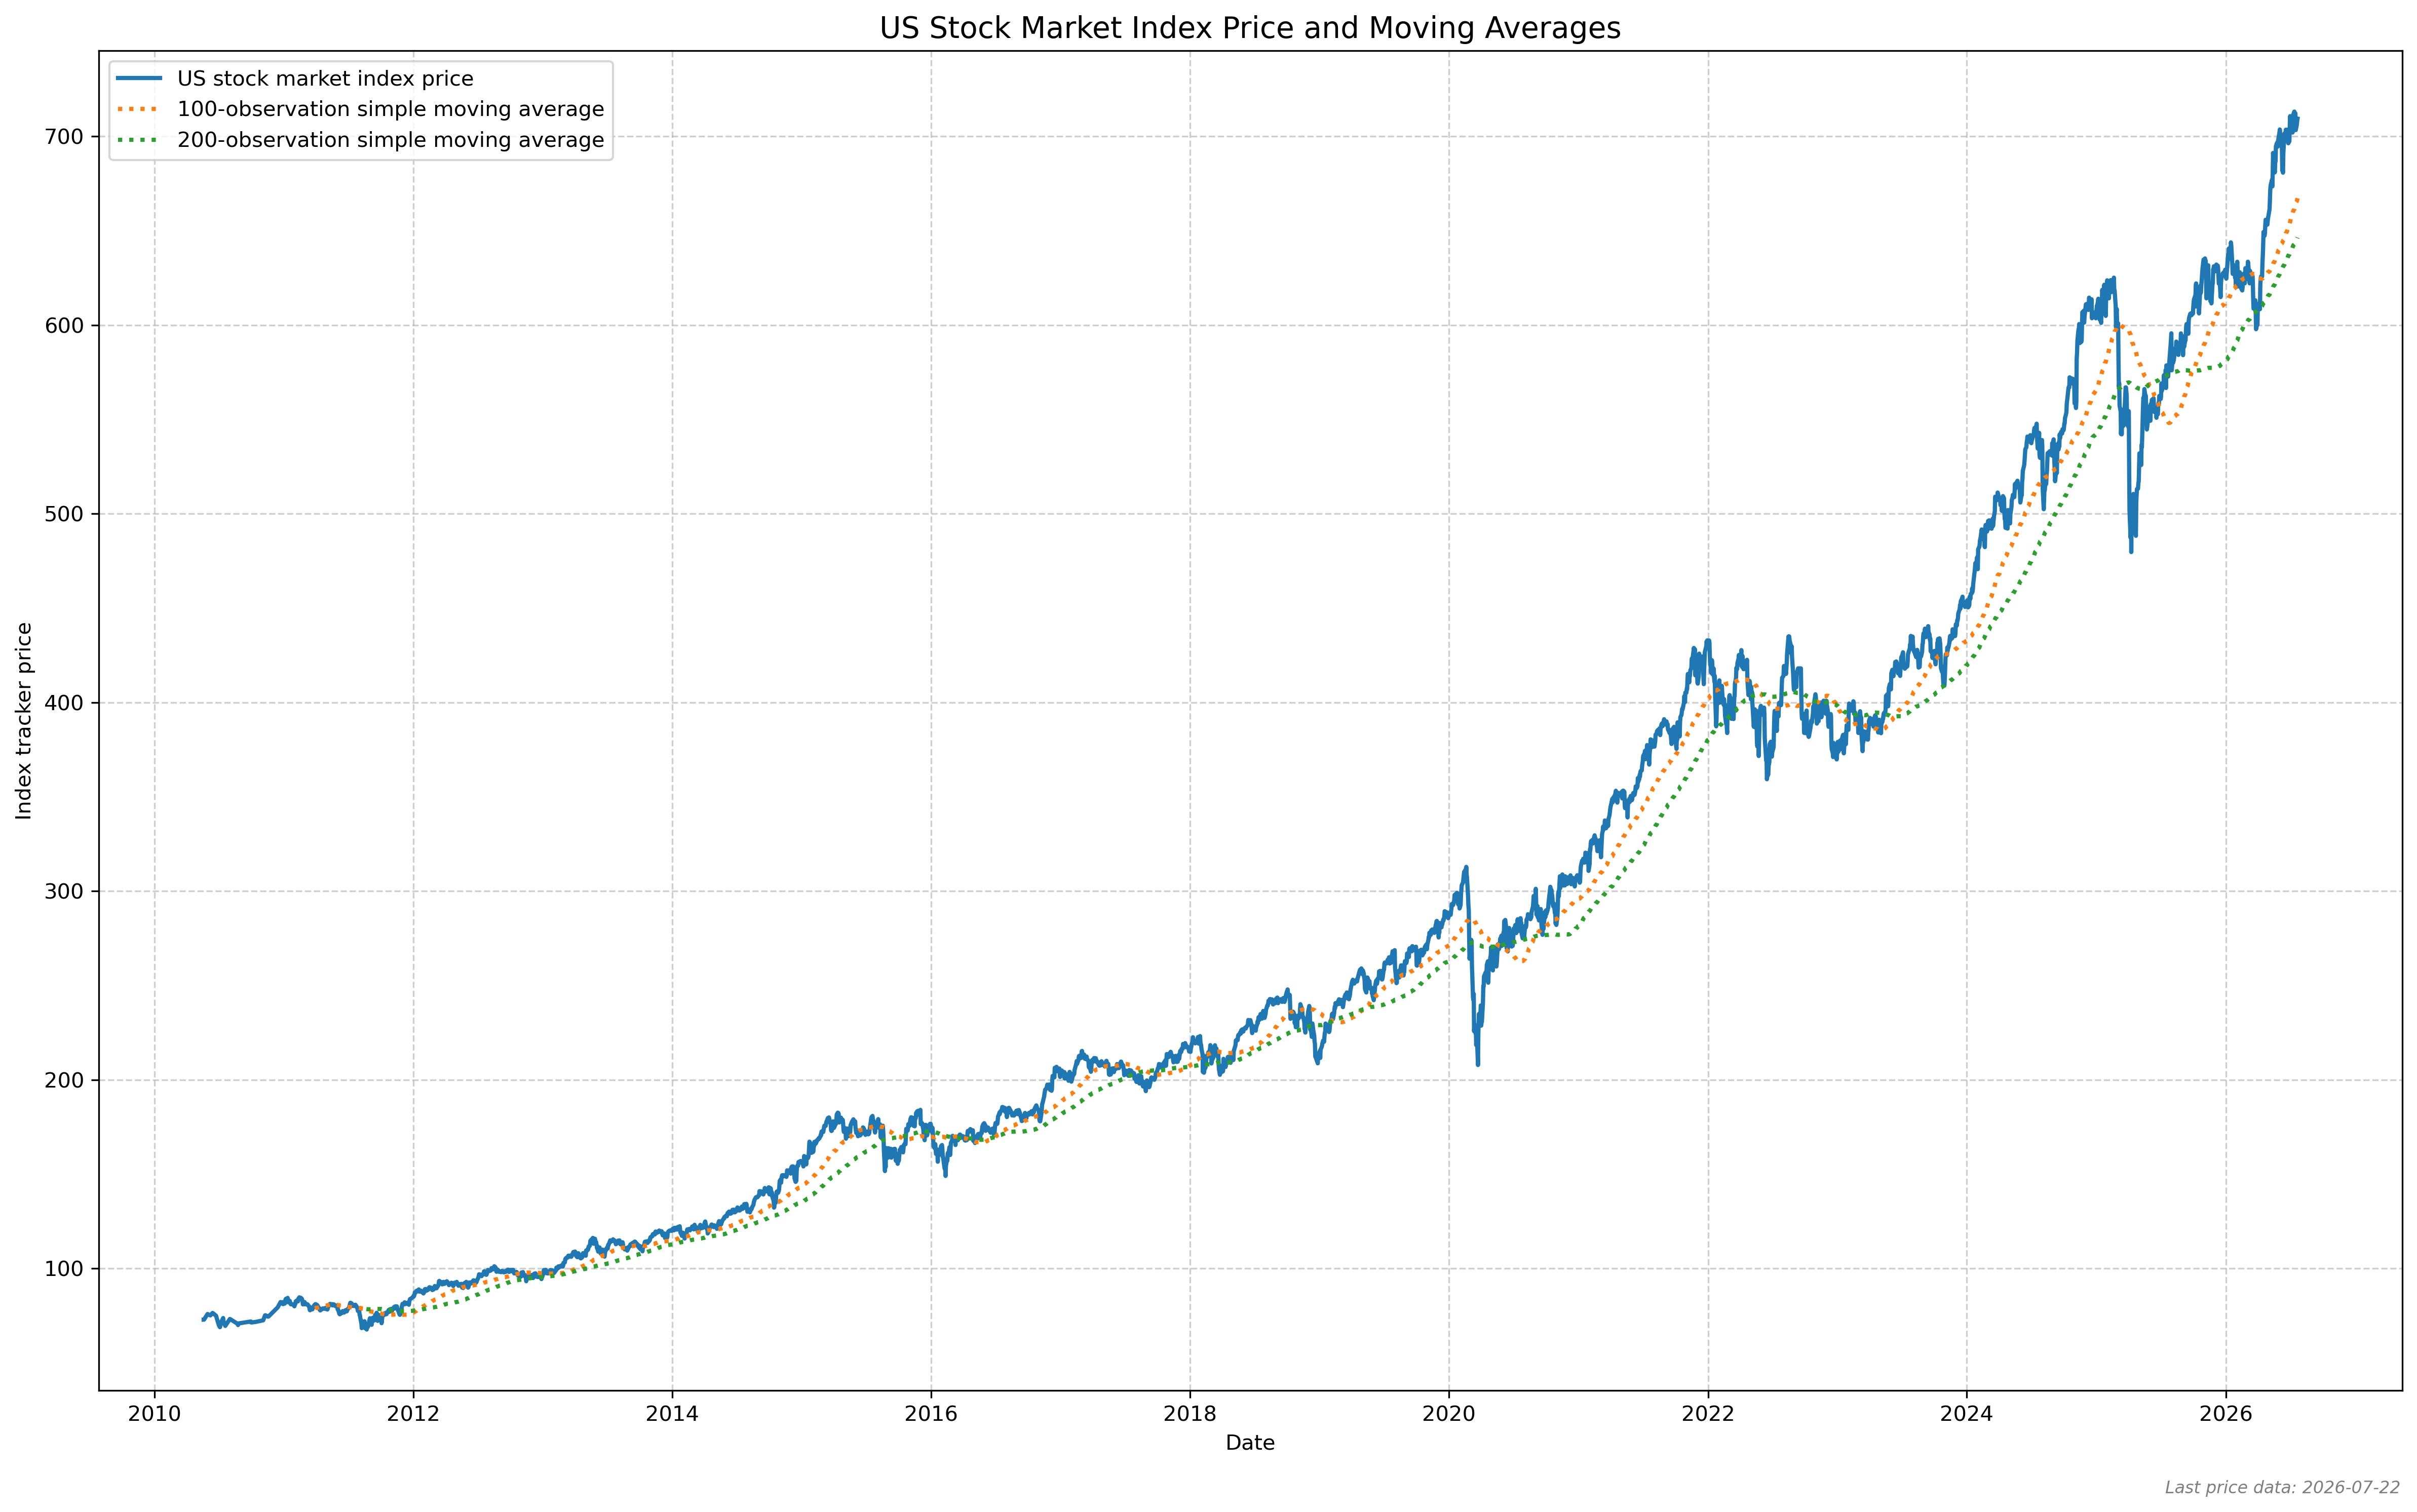
The benchmark index tracker price with 100- and 200-observation simple moving averages.
How to read
Price above both averages points to an upward trend; price below them points to weaker momentum.
Why it matters
Use it as a market-regime check before comparing stock rankings or strategy results with the index baseline.
Caveats
Moving averages are lagging indicators and do not predict turning points by themselves.
How to read this
What this shows
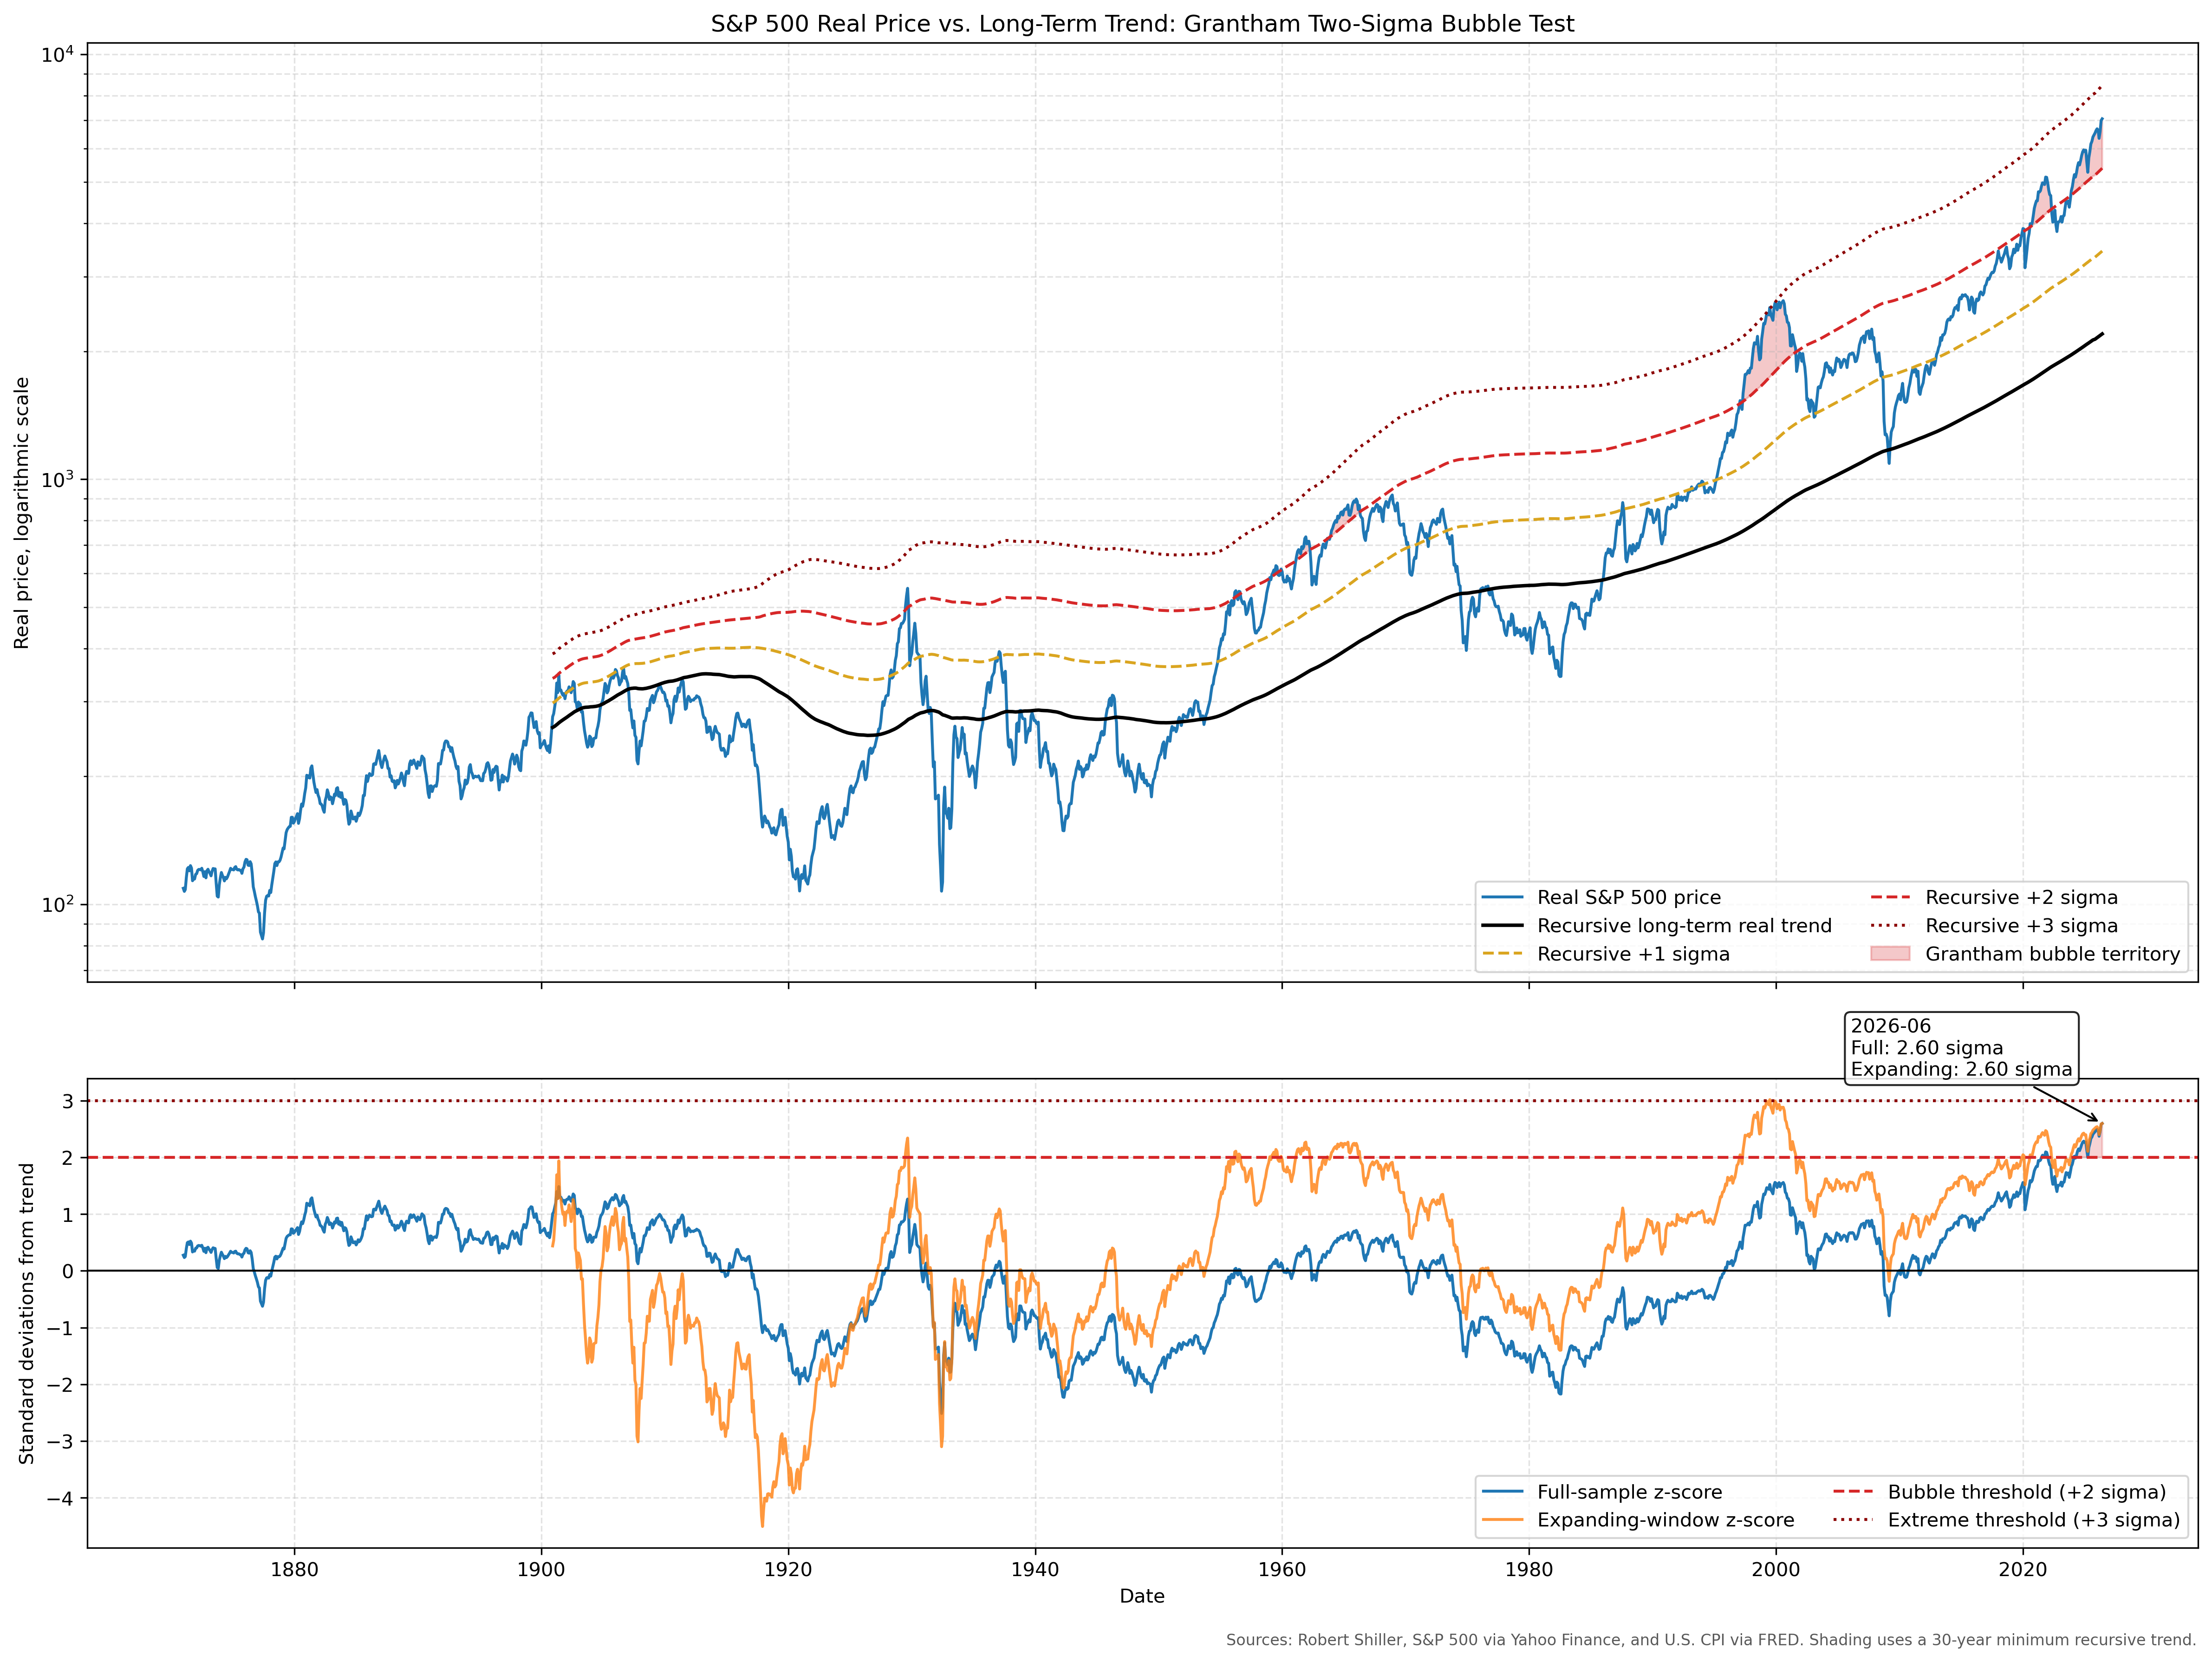
The inflation-adjusted S&P 500 price compared with its recursively estimated long-term trend and one-, two-, and three-standard-deviation bands.
How to read
Readings above the red two-sigma line meet Jeremy Grantham's statistical bubble threshold. The lower panel shows the distance from trend through time.
Why it matters
It puts current valuations in a long historical context and highlights periods of unusually large real-price deviations, including 1929, 2000, and 2021.
Caveats
A two-sigma reading identifies an extreme valuation, not the date of a market peak or crash. Trend estimates also change as new observations become available.